Still trades near recent highs....
The RBNZ will likely keep rates unchanged when they announce at 5 PM ET/2100 GMT. However, there is some speculation that they will be more in line to raise rates down the road. Any mention of moving to more normal rates should be a boost to the currency.
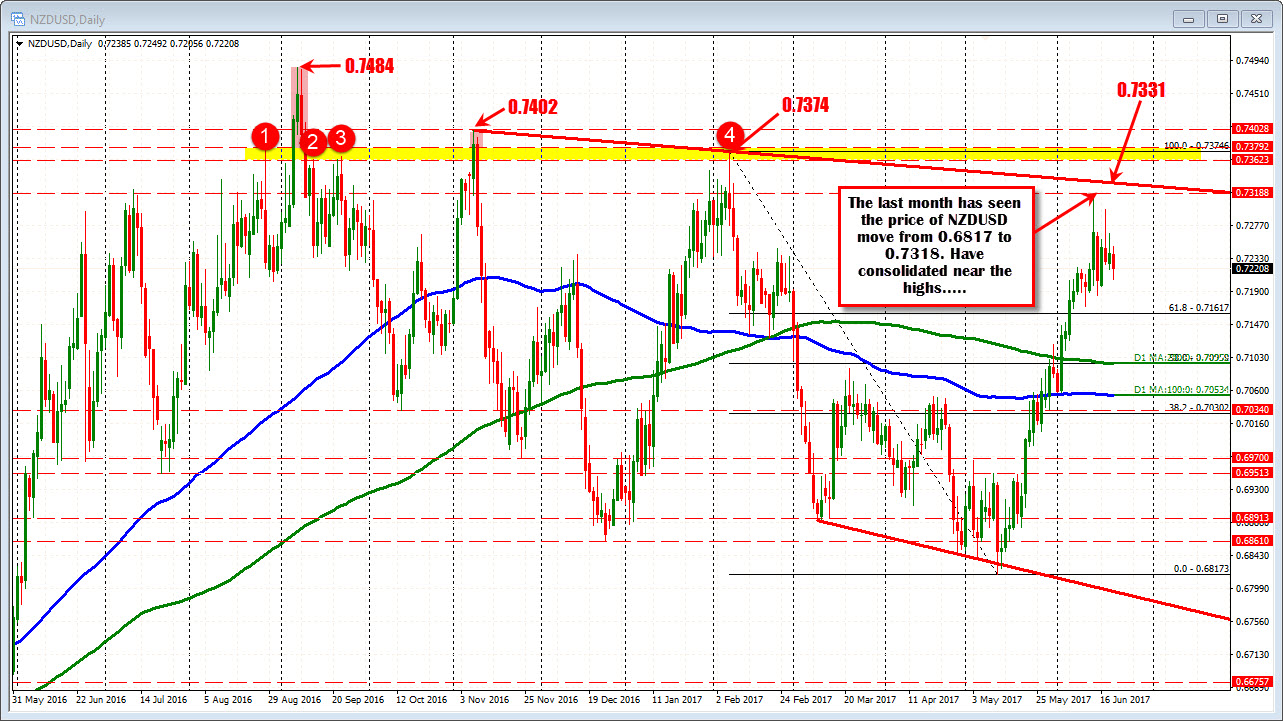
Looking at the daily chart of the NZDUSD above, the pair has been steadily climbing since mid-May. The low at that time was 0.6817. That was the lowest level going back to June 2016 (nearly a year prior).
The high this month reached 0.7318. That is still below a topside trend line cutting across at 0.7331 and the Feb 2017 high price of 0.7374. Both are upside targets on a more hawkish statement/press conference today.
The other 2016/2017 highs /upside targets come in at
- 0.7362 and 0.7379. Those levels were swing highs from August 2016, September 2016 and Feb 2017 (see yellow area and red circles).
- 0.7402. High from November 2016, and
- 0.7484. High from September 2016
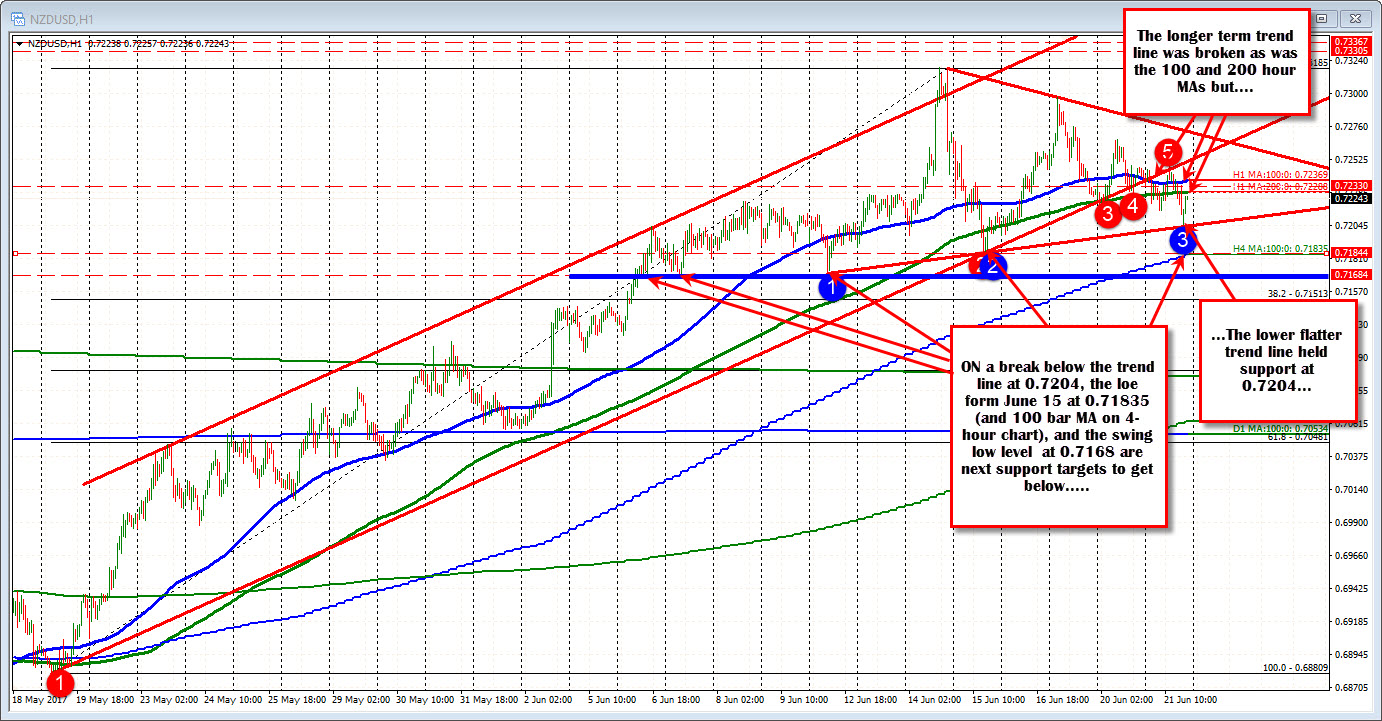
On the downside, if you look at the hourly chart below, the pair today has been trading more up and down, but is still a bit lower and moved back below the 200 hour MA (green line in the chart below).
There has not been a lot of trading done below the 200 hour MA since mid-May. So it is something new and a little bearish. However, the move is still quite modest. The low today at 0.7204, stalled at a lower trend line, and is still above lows from June 15 (at 0.7184) and June 12 and June 7th (both at 0.7168). All those levels are downside targets on dovish/less hawkish talk from the RBNZ and Gov. Wheeler.
Pay close attention to the 0.7168 level (blue solid horizontal line in the chart below). A move below that level opens the door for further corrective selling. Holding would likely attract other dip buyers and a move back higher.