Below 200 bar MA on 4-hour and swing levels
The GBPUSD has moved to new session lows and in the process has made a break below the 200 bar MA on the 4-hour chart and below what has been swing levels going back to mid-January (see yellow area in the chart below).
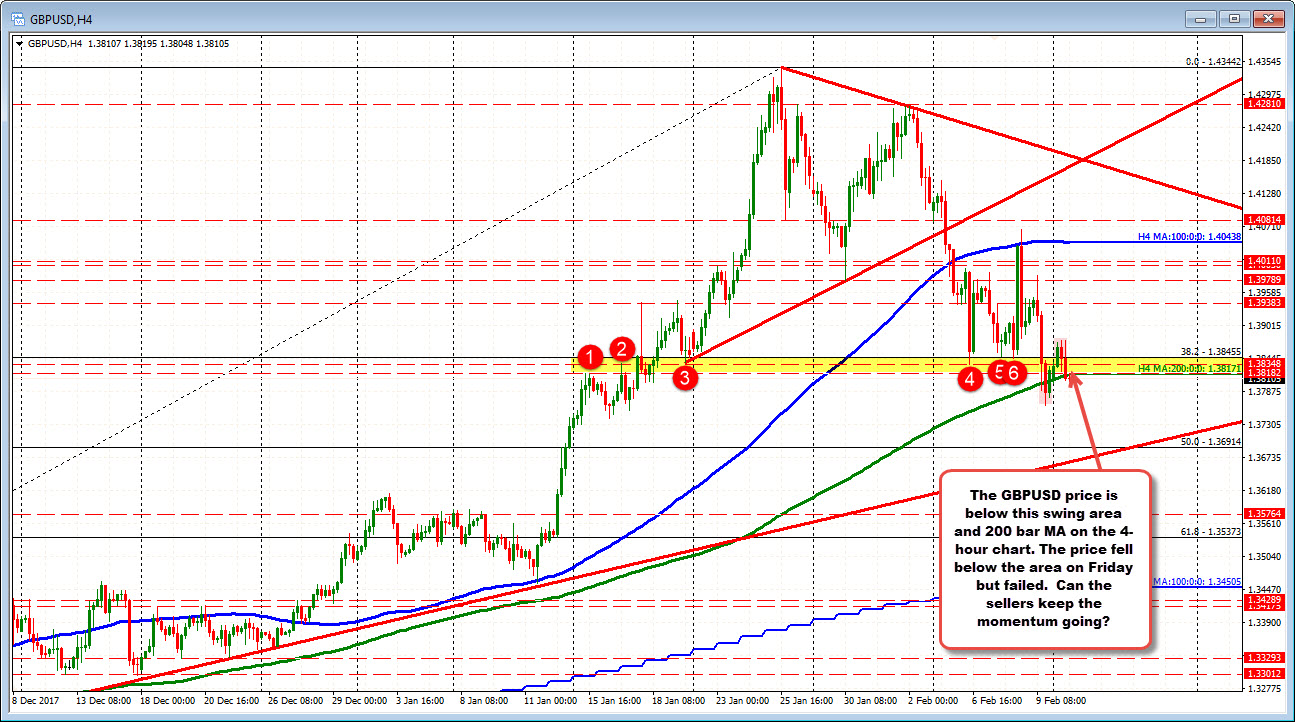
Now, on Friday, the price tried to break below the same area and failed. Today, the price tried to break above the yellow swing area and failed (see red shaded areas in the chart above).
This is the third try. It is up to the sellers to keep the momentum going. Another failure and the sellers may give up and return to buying (again).
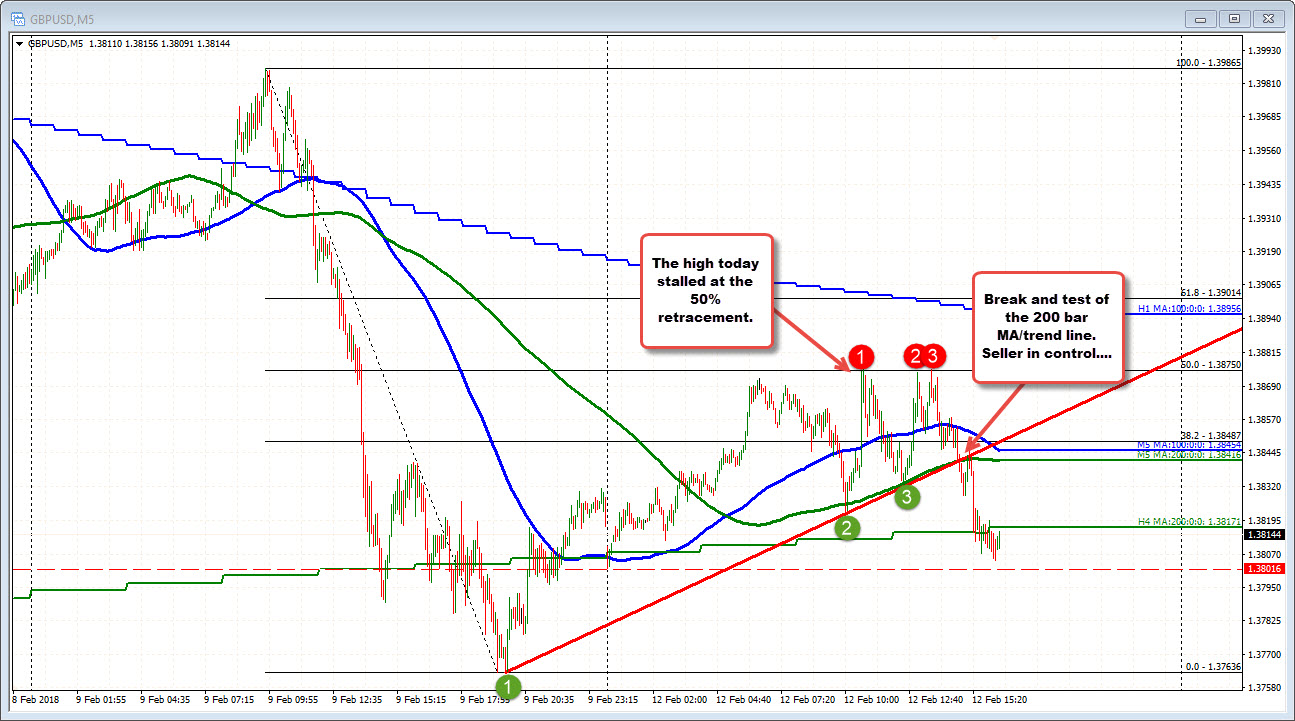
Drilling to the 5-minute chart, at the day highs, the price stalled against the 50% at 1.3875 level 3 separate times. Although the price moved above the "yellow swing area" on the 4-hour chart above, the 50% stalled the rally. The break below the 200 bar MA on the 5-minute chart and the trend line turned the buyers to sellers, the price bias moved more to the downside. If the price cannot stay below the 200 bar MA on the 4-hour at 1.3817, the 200 and 100 bar MA on the 5-minute chart will now be risk for shorts at 1.3841-45. Stay below is still more bearish intraday.