
Despite managing to knock out the 2008 & 2009 highs USDCAD is heading back south
The break of 1.30 and then the 2008/09 highs at 1.3025/63 pushed us up to even break 1.31 by a few pips. The failure to hold onto those broken levels on a retest was the biggest clue that we were heading for a fake out
The move back through 1.3065 has found resistance coming in ahead of it around 1.3045/50. The fall hasn't stopped there and while we held above the 2015 broken channel top yesterday, we've come down through it today
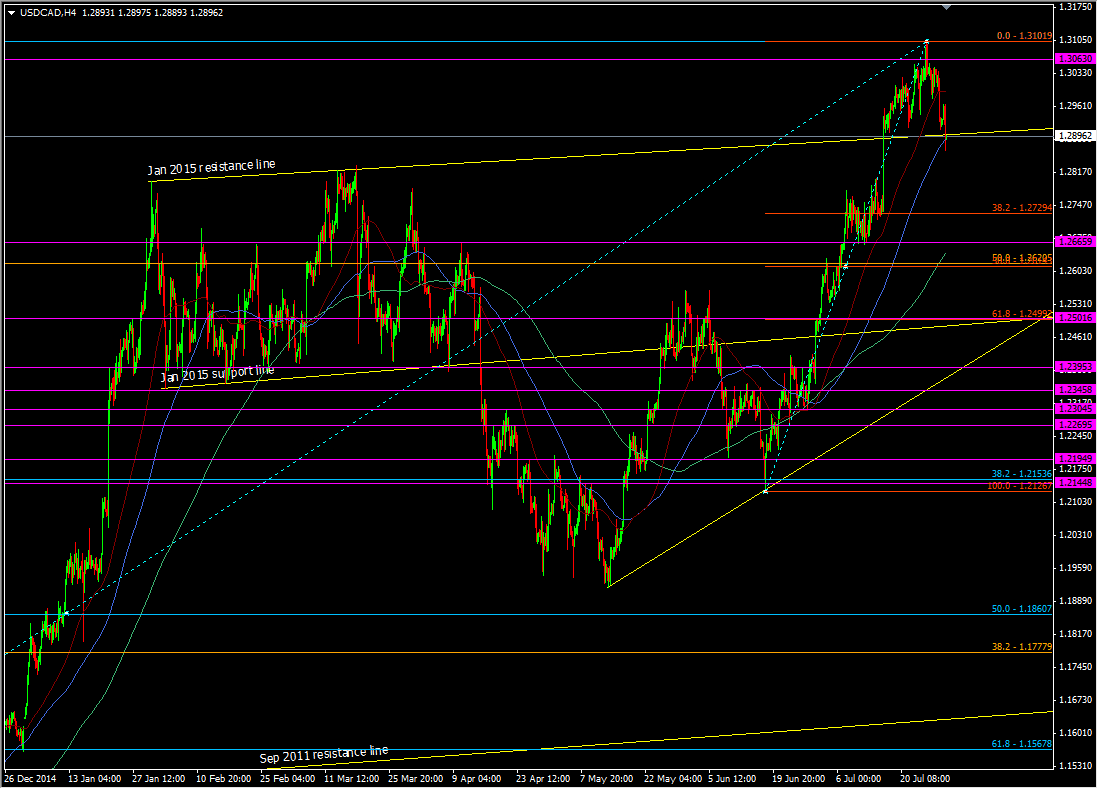
USDCAD H4 chart
The trend line is already seeing resistance build so technically the pair is building for a push lower.
The caveat is that the CAD looks to be firmly trading on oil today with WTI having been up nearly $2 since the inventory data, coinciding with the move lower in USDCAD
With the FOMC being a big dollar driver today, the fact that USDCAD is lower means it could catch a bid on a hawkish Fed. If oil remains rising that's going to give loonie traders a good opportunity to scale into USDCAD shorts at higher levels. Now we're back below 1.30 the hard work has to happen all over again. This could well be one of the best trades to look at in the immediate aftermath of the FOMC

