October 27, 2016
The key US GDP will be released tomorrow at 8:30 AM ET with the average estimate calling for 2.5% quarterly annualized. That will dominate trading for what is left in the week. The dollar has moved higher in anticipation of a good number. The odds of a December rate hike has also increased and bond yields are also higher in anticipation of the December Fed hike.
So what do the technical picture look like in some of the currency pairs?
Let's take a look.
USDJPY
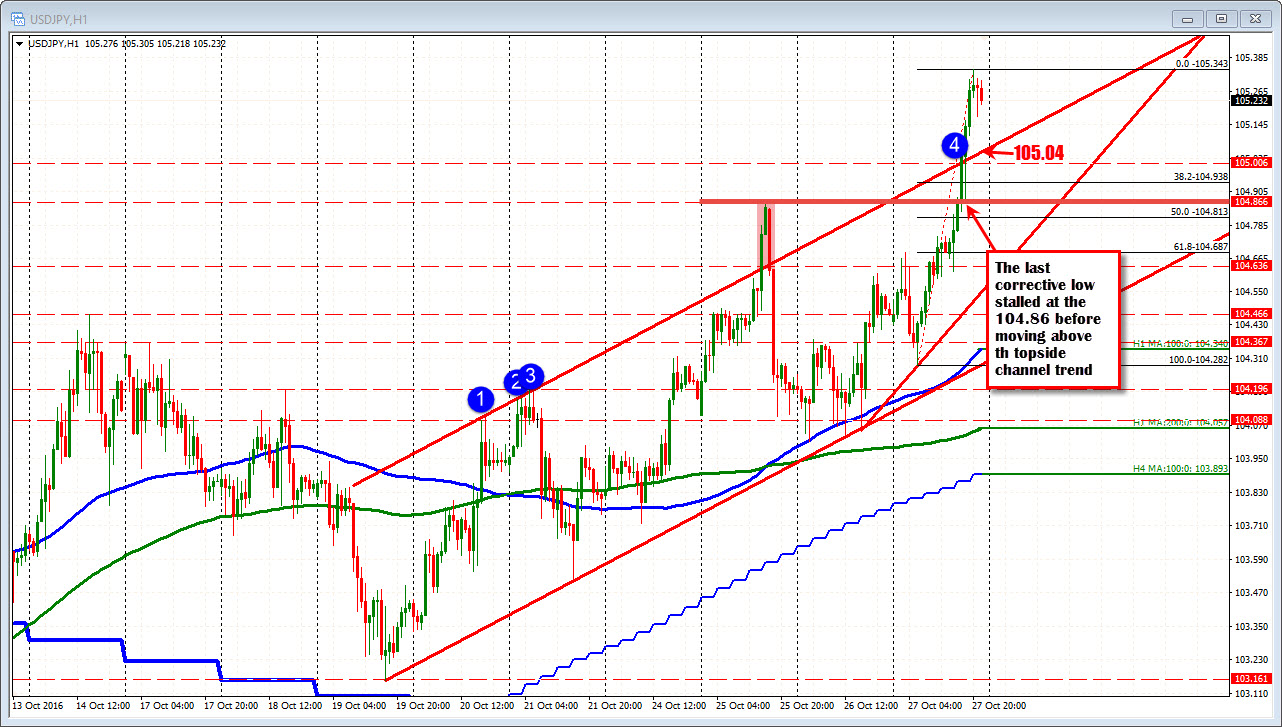
The USDJPY pushed higher today. that move saw the price move above the high from Tuesday, a topside trend line and the 105.00 level. The topside trend line comes in at 105.04 now and is close support (that line is moving higher). An alternative risk level might be the 104.86 high from Tuesday. Move below it and traders lose the faith (even more).
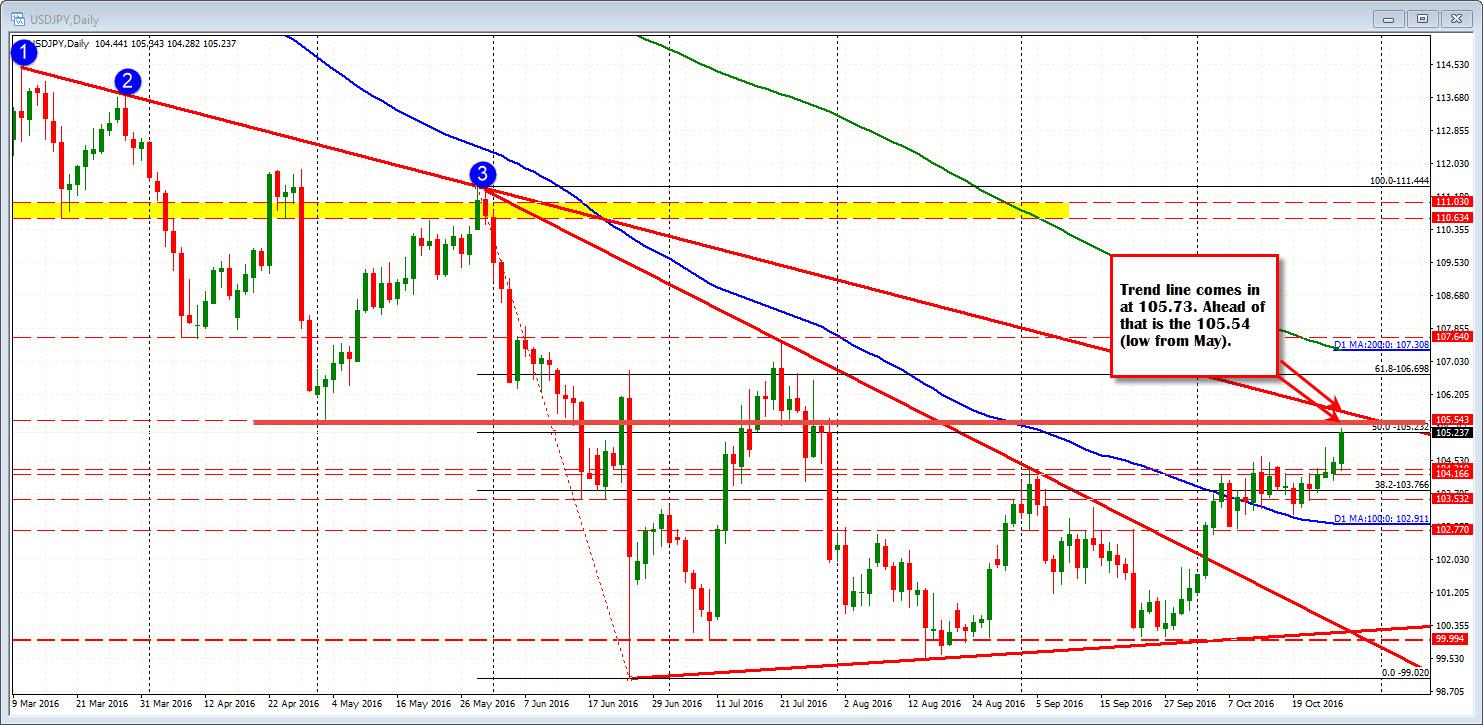
Now on the topside from the daily chart the pair has resistance ta 105.23 (testing now) and then the 105.73 trend line (follow the blue circles on the daily chart below). Above those levels and there is more open road ahead.
EURUSD
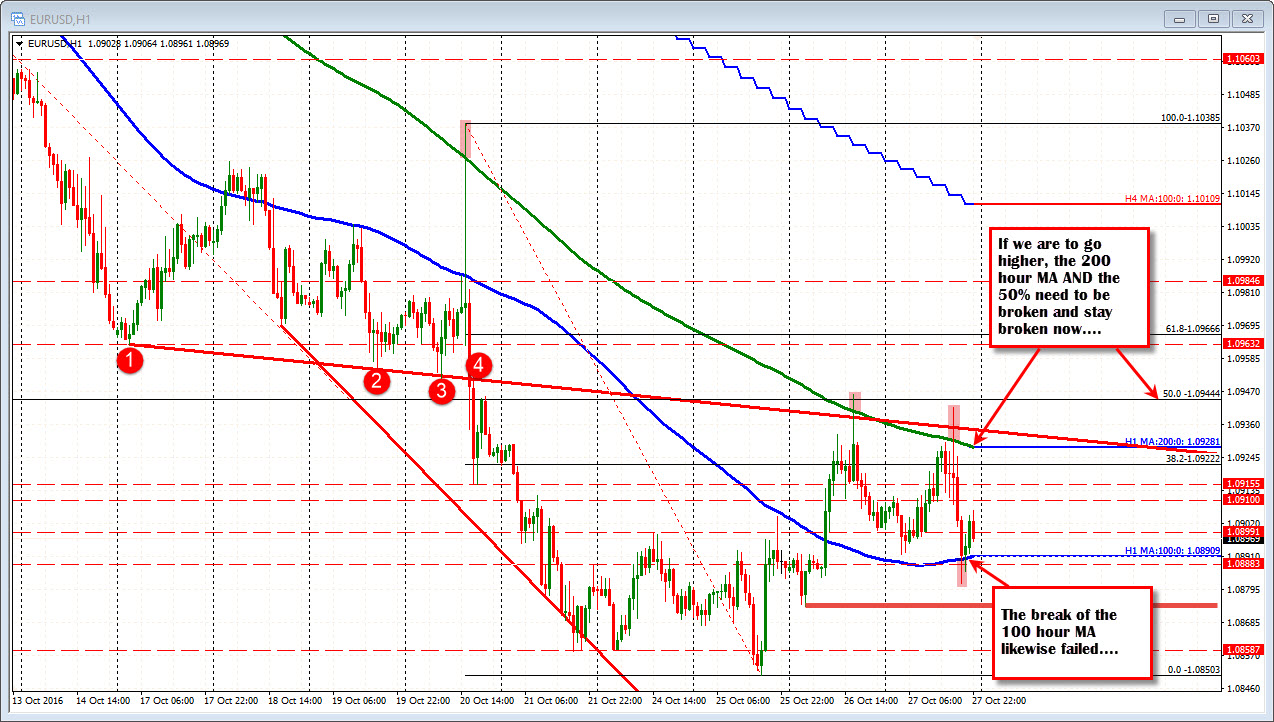
This time yesterday I was talking up the 200 and 100 hour MAs and how at some point we will get a break and run.
Well there was a break above the 200 hour MA (green line in the chart above), but the run fizzled. Later in the NY afternoon session there was a break of the 100 hour MA (blue line in the chart above), and the price failed. The market is still unsure of itself, but the same dynamics are still alive technically for the pair.
GBPUSD
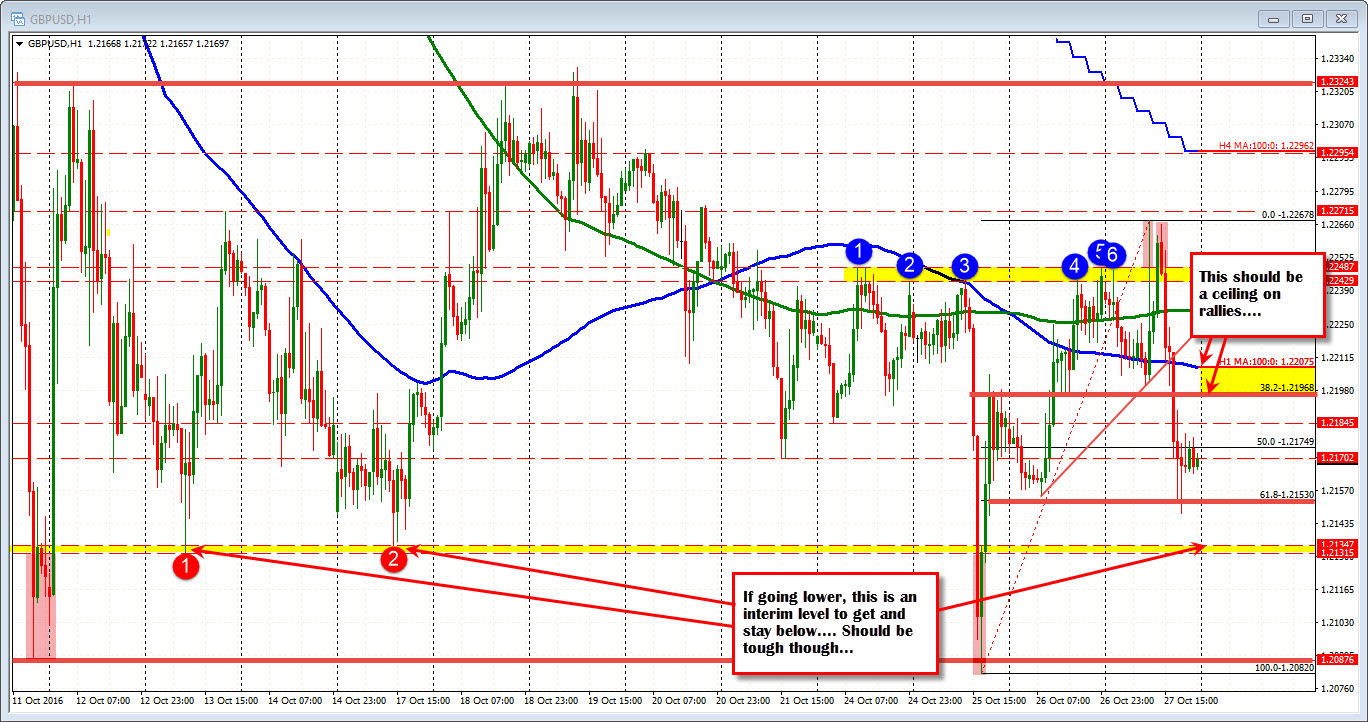
The GBPUSD price action remains up and down. Today was a down day.
A catalyst for the downside today was what could not happen on the topside. Specifically, the price moved above a week long ceiling that developed between 1.22439 and 1.22487. That high area (yellow area in the chart above) was broken twice and fail twice.
Thais is all the buyers needed to see and the sellers pushed the price below the 100 hour MA, a trend line at the same area (see blue MA line in the chart above) and then below the 1.2200 level.
Once the 1.2200 level as broken there was additional downside momentum that stalled near the 61.8% of the move up from the week's low to the week's high (at 1.2153).
With the price action moving up and down since October 11th (with lots of intraday ups and downs too), you have to tread lightly. For sellers, who like the short side, the 1.2200-07 (100 hour MA is at 1.2207 currently) area should be an area to lean against on a rally. On the downside a move below 1.2131-34 will be eyed
AUDUSD
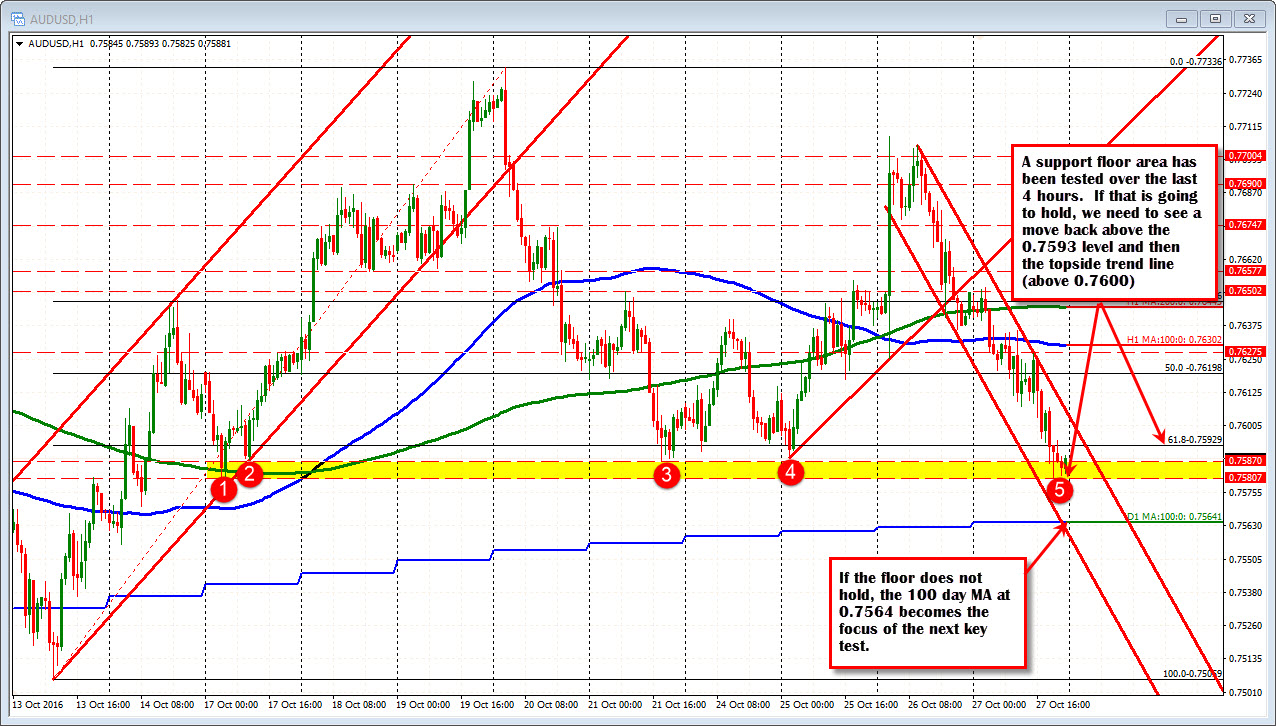
The AUDUSD was the big loser in trading today. It fell 0.84% vs the US and was the weakest currency overall.
That fall has taken the pair to a floor support area defined by 0.7580 -87. The last 4-5 trading hours has seen the price hang around the area.
What now?
If that floor area is going to hold than we need to see the price move back above the 0.7593 level (61.8% retracement) early in the new trading day. A move above will then look for a move above the topside channel trend line on the way to 0.76198 (50%) and the 100 hour MA at 0.7630. Those levels should all be a struggle.
If the minimum of getting above 0.7593 or 0.7600 cannot be done, the path of least resistance should see a continuation down toward the 100 day MA at 0.7564. That level should be a challenge to get through on the first look (expect profit taking).
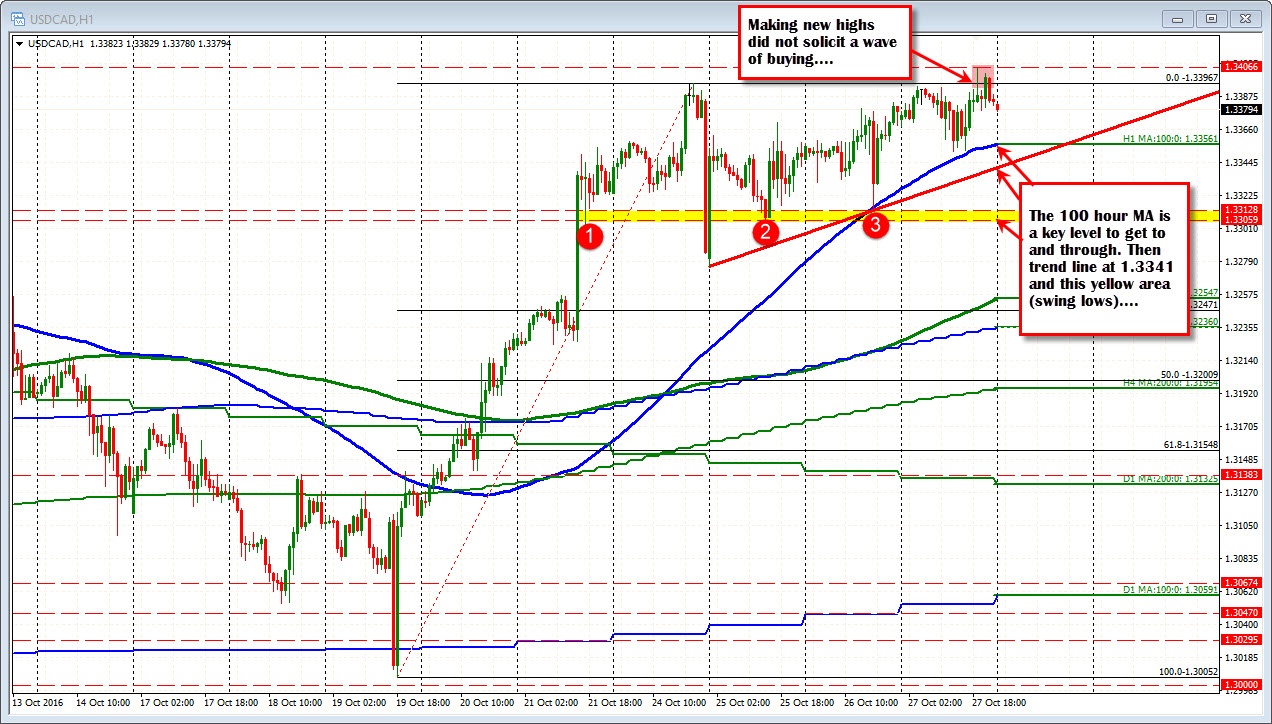
USDCAD
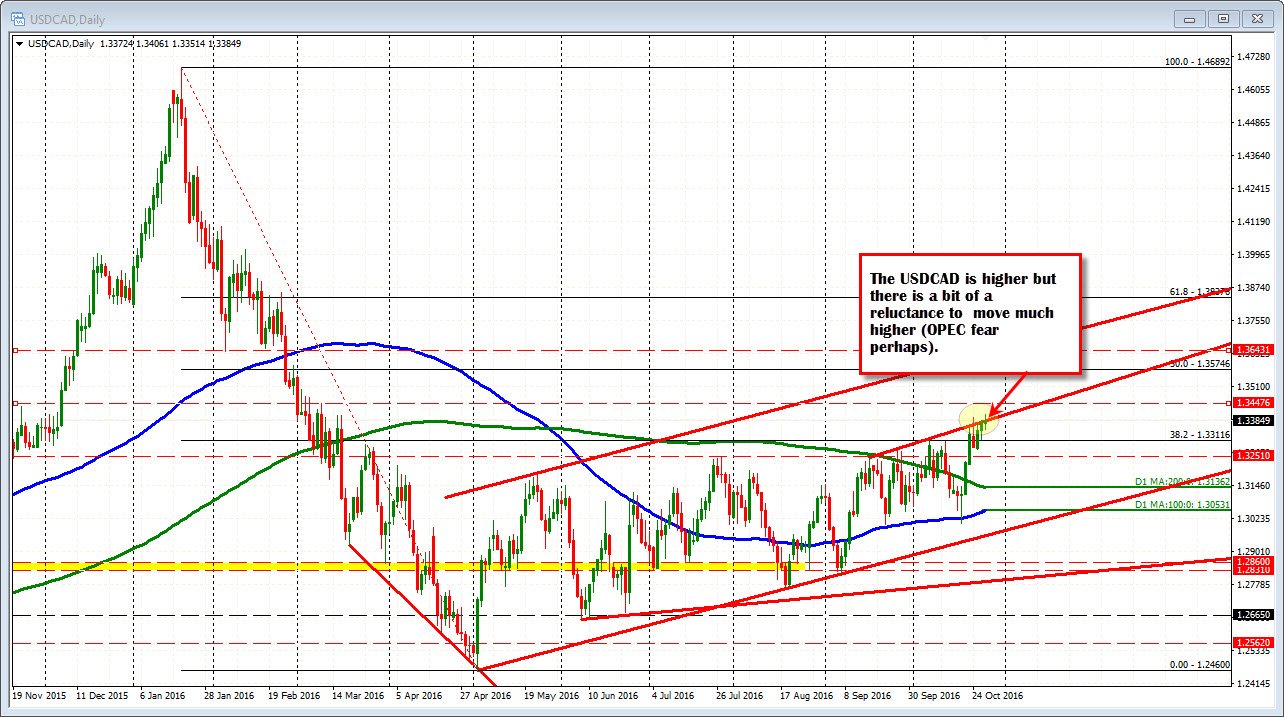
The USDCAD has been flirting with a topside trend line on the daily chart this week. That line cuts across around 1.3382. The price has extended above that trend line on Monday and again today. We are trading near that level at the close. The market does not seem to be in a big hurry, does it?
Looking at the hourly chart, the pair bounced off the 100 hour MA for the 2nd consecutive day (blue line in the chart below at 1.33557).
The pair had a chance to extend higher - taking out the high price from Monday on two separate occasions but each break failed. The buyers again seem reluctant.
Traders may look to lean against the high and see if the break of the 100 hour MA kicks in some rotation lower. Other targets to get through on the downside would be trend line at 1.3341 and the 1.3305-12 area (see yellow area in the hourly chart below).