
Comes down from 1.2500 test
Yesterday, it was the USDJPY's day. The pair surged higher trading at the highest level since 2002. The next targets on the daily chart were centered at the 1.2579-89 - high prices from December and November 2002.
.png)
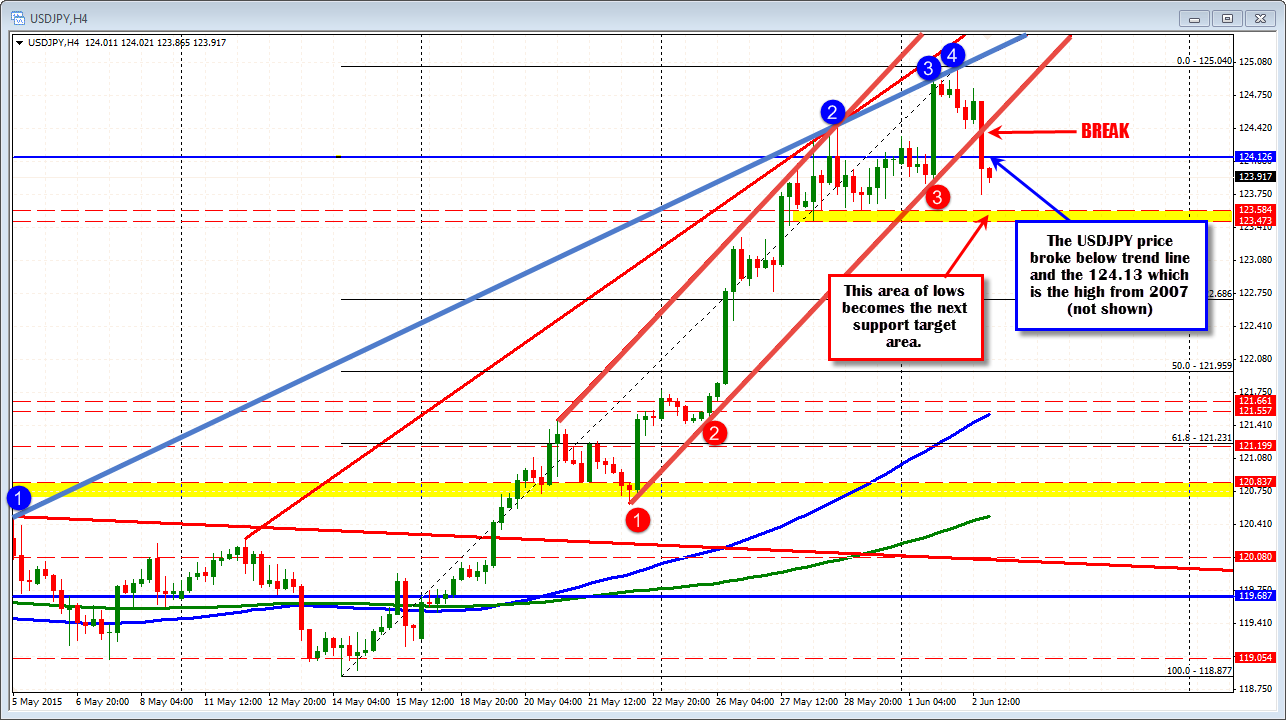
Looking at the 4 hour chart, interim targets could be defined against the trend lines connecting recent highs. The first line connected highs from May 5th and May 28th. That line cut across at 125.02 earlier today, and that is where sellers put a lid on the pair (the high reached 125.04).
As today has progressed, the pair has been following the fortunes of the USD lower. The correction has taken the price below the trend line support and also back below the high from from 2007 at 124.13 (not shown). With the price trading at 123.90 currently, the 124.13 level will now be eyed as a level to retake on the topside if the buyers are to take back more control.
Looking at the 5 minute chart, the price has been above and below that level in the up and down volatility today (the pair has been pushed and pulled by stocks and some of the JPY crosses). The highest correction of the NY session has come up short vs the 50% retracement (see yellow area). So sellers have kept some of the control. The 100 bar MA (blue line in the chart below), is moving toward the 50% level, and lower. This will be eyed as additional topside resistance. On the downside, there is some pretty good support in the 123.47 123.58 area. This is where and then a number of lows (see yellow area in the 4 hour chart above).
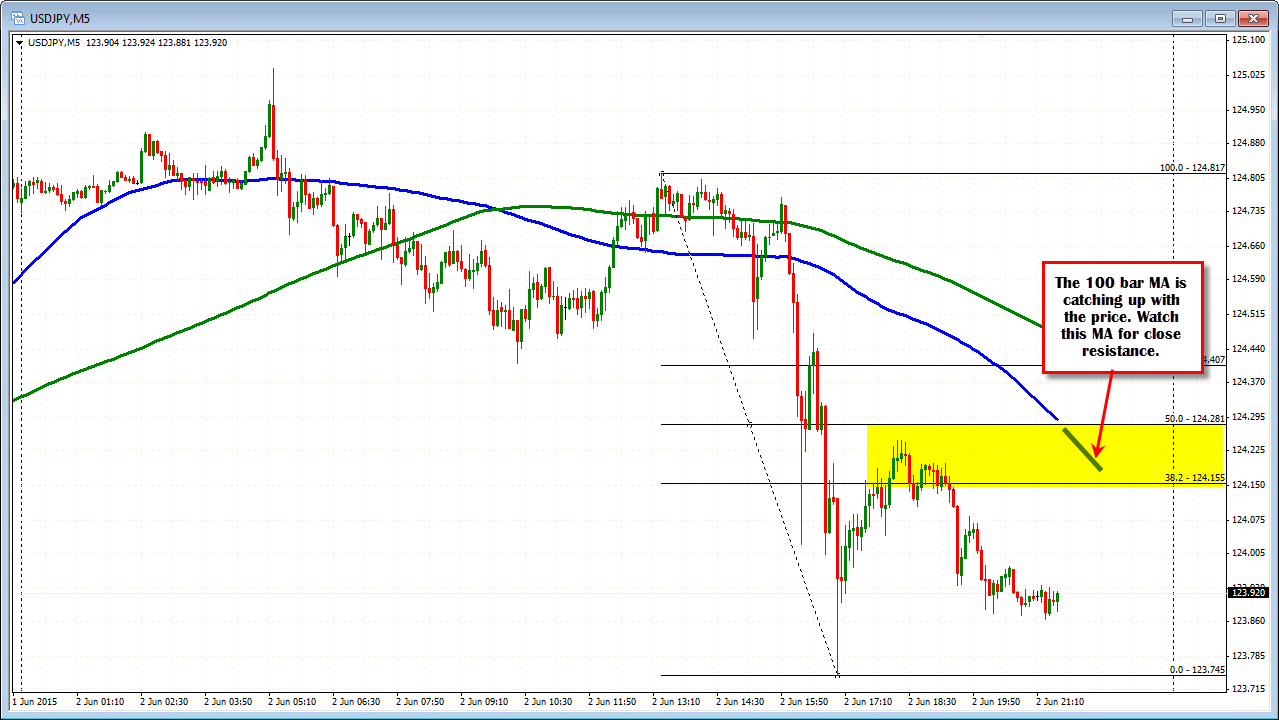
Overall, the USDJPY has has a bearish day with the dollar bearish. Watch the 100 bar MA. Watch the 124.13. Move above and today was just a correction off a nice top. Stay below and the price will next look for the floor support on the 4 hour chart to gauge how strong are the sellers.
PS be aware for the pair becoming more range bound....

