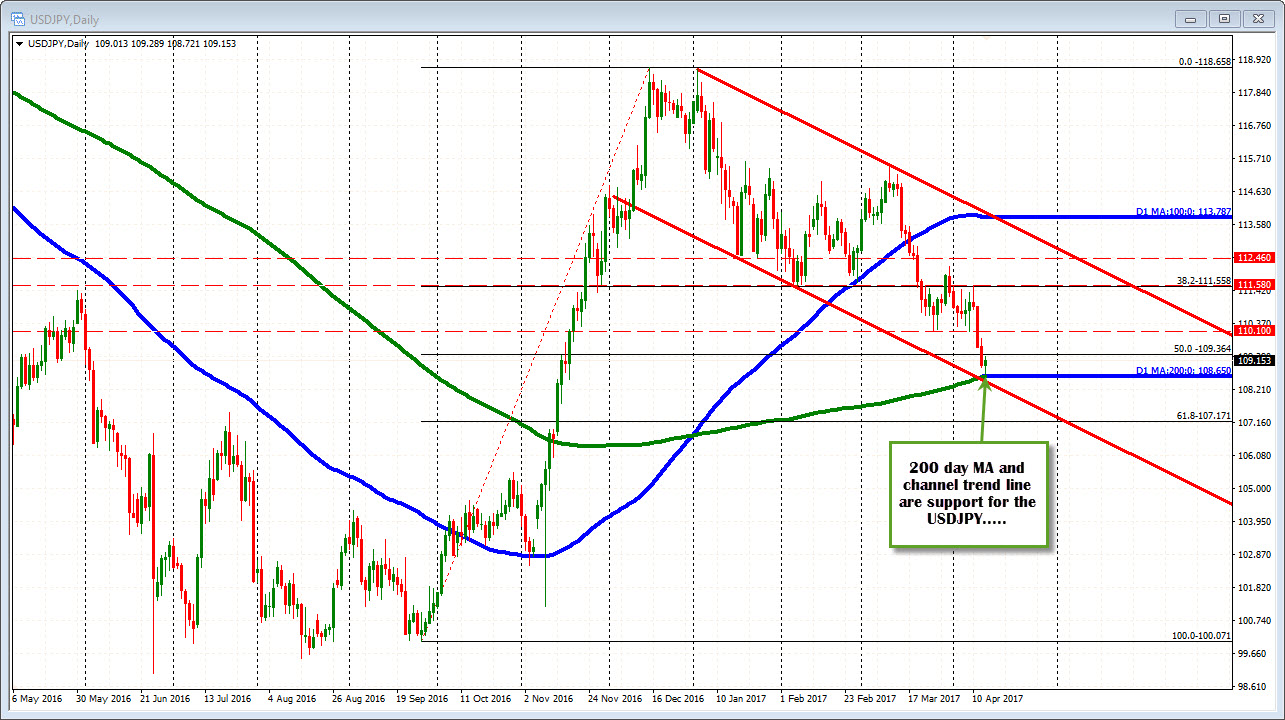
200 day MA stalled the fall
The USDJPY has seen a recover and trades higher after the Trump inspired sell off yesterday. The claims data was better. PPI data? Not so much. Nevertheless, the USDJPY moved to new highs Having said that a trend line on the hourly chart that connects recent highs is ahead at the 109.29 level and the low from yesterday(pre-Trump) is overhead resistance. The high just reached 109.29.
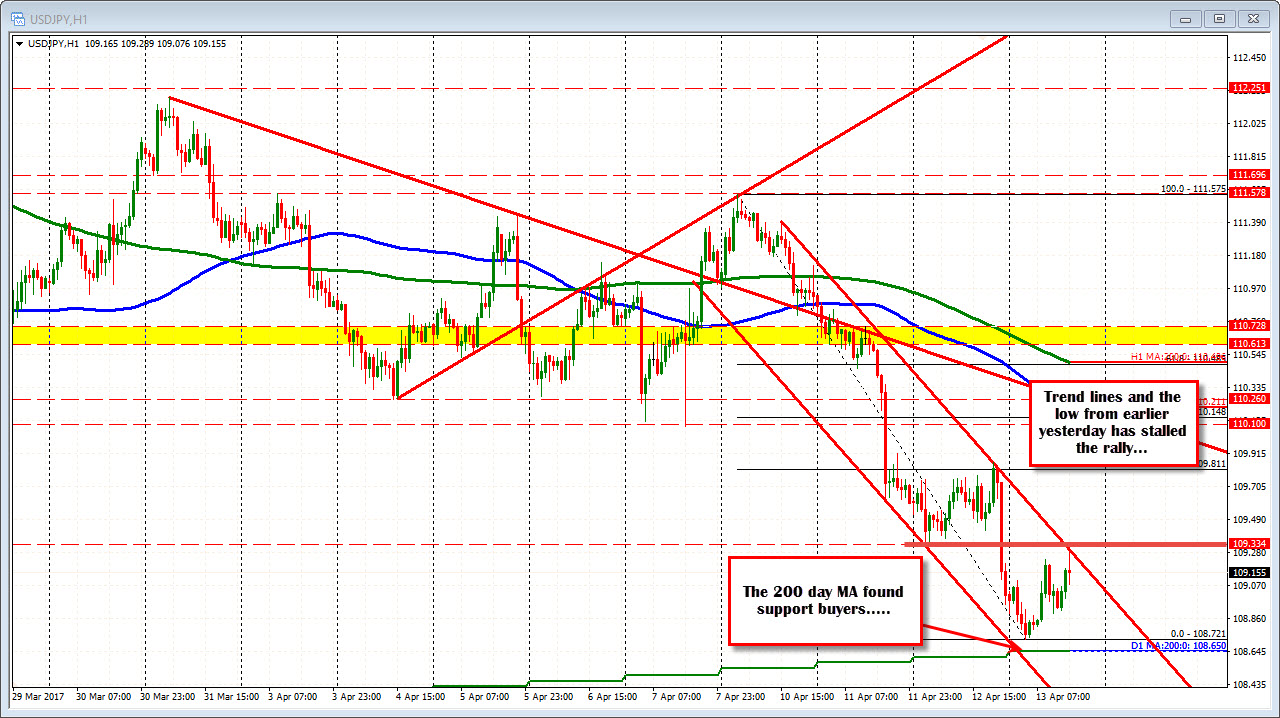
At the lows today, the price found the low risk buyers against the 200 day MA at 108.65. The low got to 108.72. Early buyers could not resist Trump or no Trump (since when is he a currency expert anyway?).
US bond yields remain a focus and the 10 year fell below the 2.30% yesterday and closed at 2.239%. That is where it is trading now.
What now?
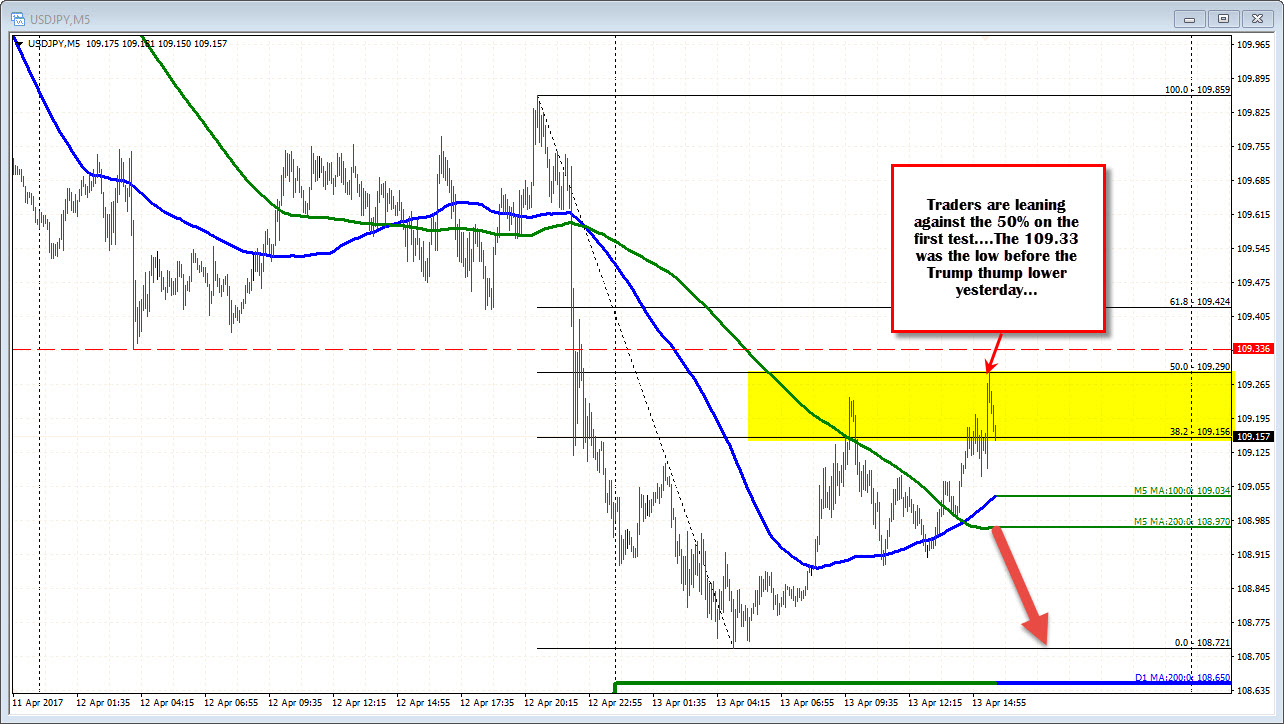
Well technically, the 109.29-33 is overhead resistance that needs to be taken out. Looking at the 5 minute chart below the 50% of the move down from the high yesterday comes in at the 109.29 level too. So a key level to get and stay above if the buyers are to remain in control.
On the downside, the price closed at 109.00 yesterday. The 100 and 200 bar MA on the 5-minute chart is at 109.03 and 108.97 respectively. Getting below that area would be more bearish for the pair intraday.