
The 1.0564 to 1.0638 is where most activity occurred....
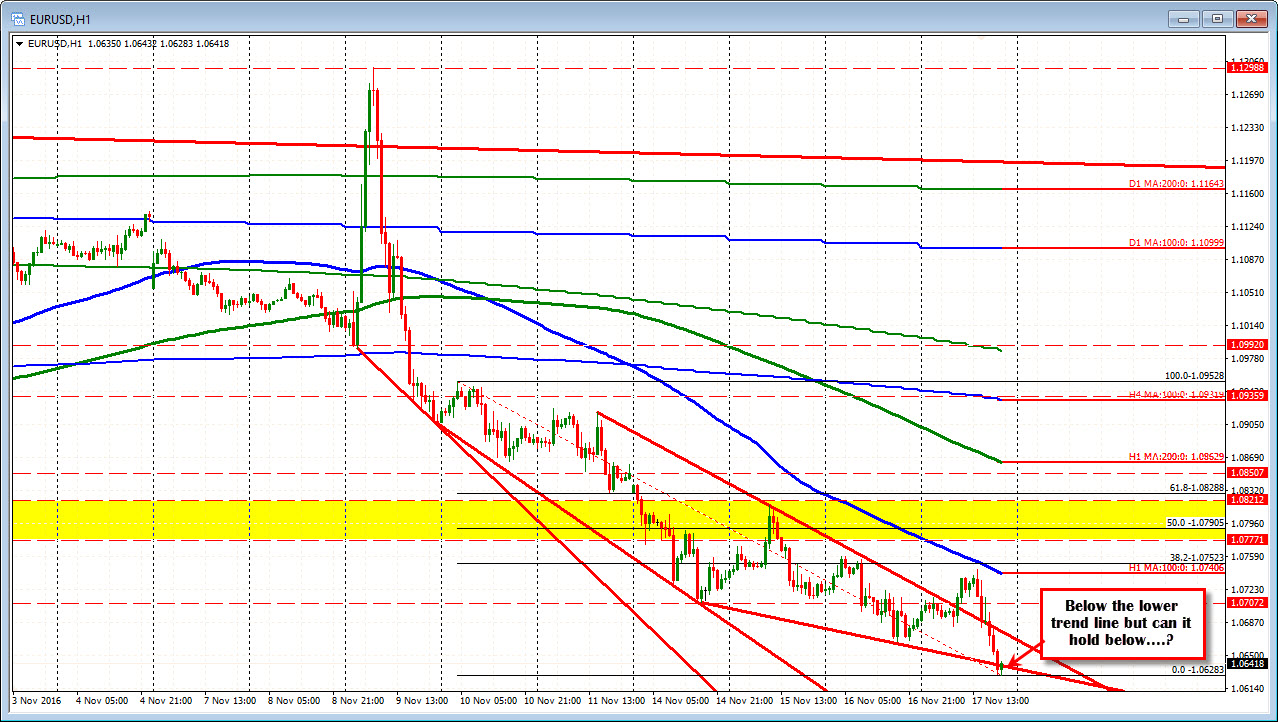
The EURUSD just traded to a new session low at 1.0630. The price has not traded this low since Dec 3rd 2015. Looking at hourly chart the price fell below a trend line at the 1.0639 level but stalled at around the 1.0630 level We are back testing that trend line.
What did the hourly chart look like the last time the price traded this low back in December 2015?
The chart below is what happened at that time.
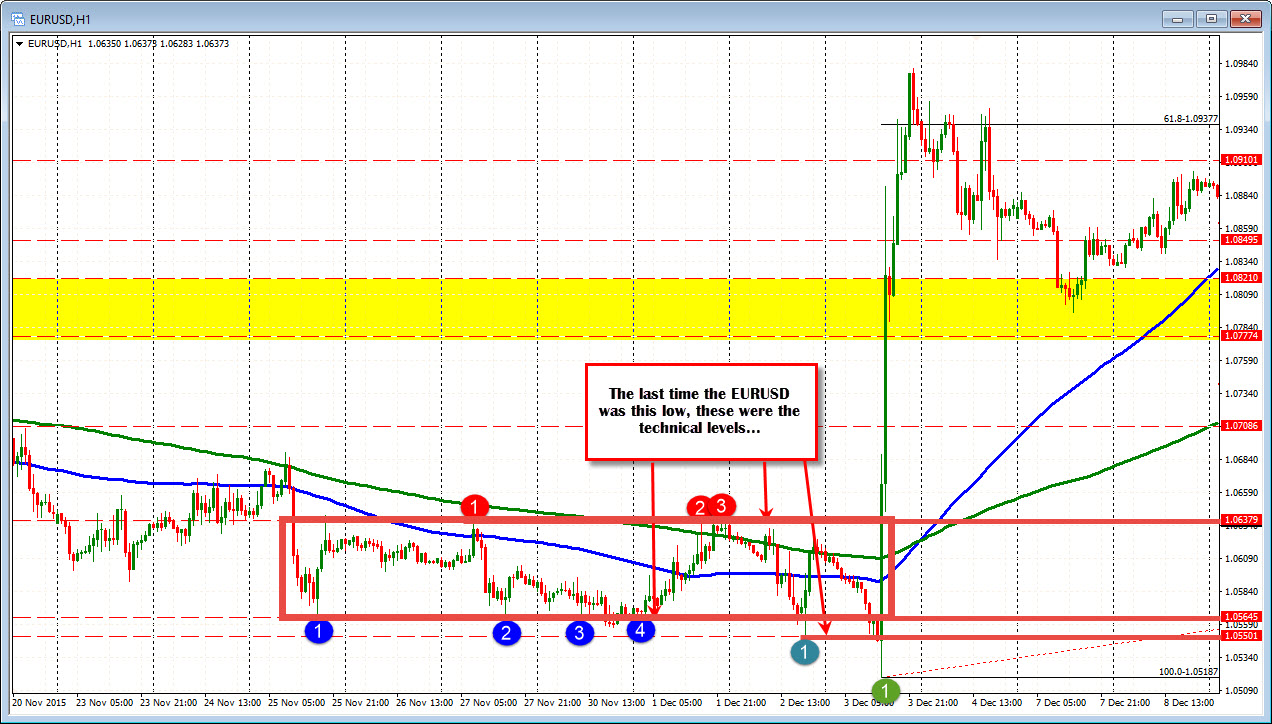
Over a 5-6 day period the price traded between 1.0564 and 1.0638. The higher extreme is where we trade now. So this area is near that topside level (top of the red box in the chart above). Him and
It was a while ago (nearly a year) but traders will drill down and look to see what happened the last time we traded at these level.
Looking at the chart, the topside of the consolidation area, happens to correspond with the trend line on the current hourly chart. So it is a key level now and was a key level back then.
Let's see if the profit taking buyers come in at the level (RIGHT HERE)l. I would NOT be shocked if they do show up. (risk is defined and limited - 10 or so pips). IF we do not find buyers, we could be on our way toward the 1.0564 level.

