
With trend lines defining extremes and MAs in the middle....
The NZDUSD peaked for the year on Feb 7th and bottomed in March near the 2017 lows. There were three separate lows at the 0.6889-93 area. The January low reached 0.6884. So overall 4 lows in the 0.6884 to 0.6893 range.
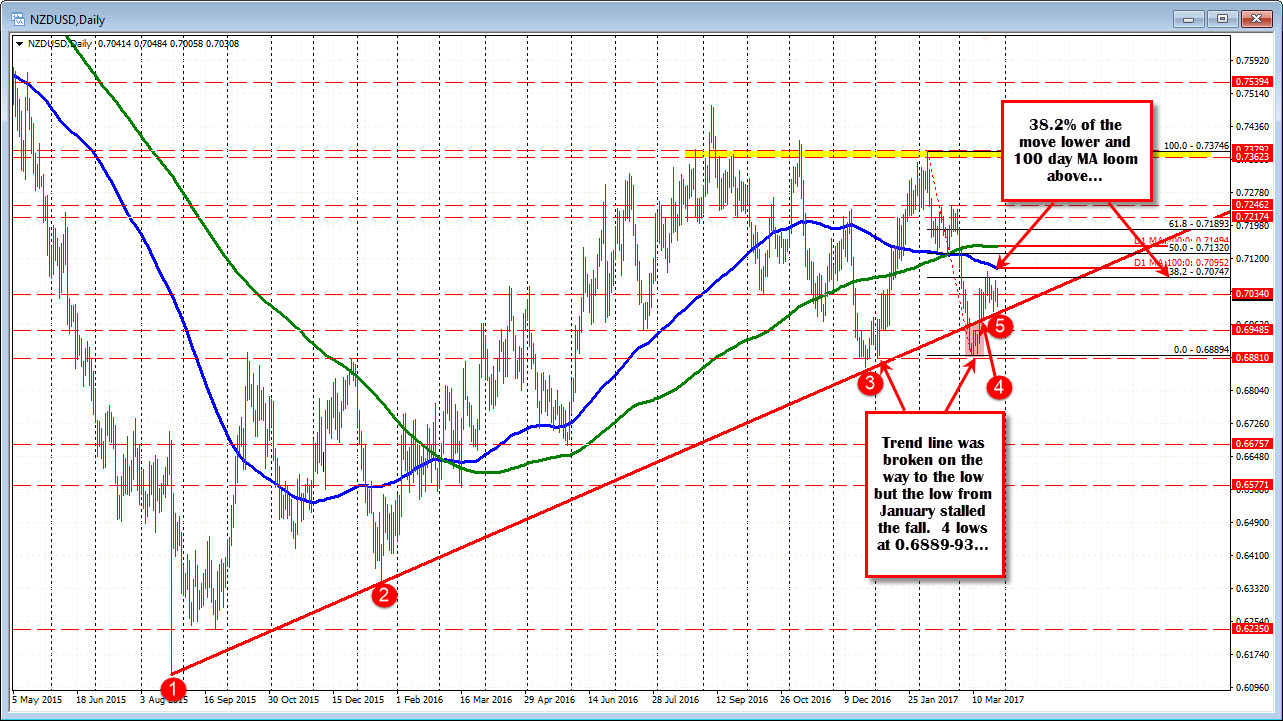
The rally higher in March has taken the pair to the 38.2% retracement of the move lower at 0.70747. We did move above that retracement line last Tuesday but moved back below and have stayed below. The 100 day MA is further up at 0.7095.
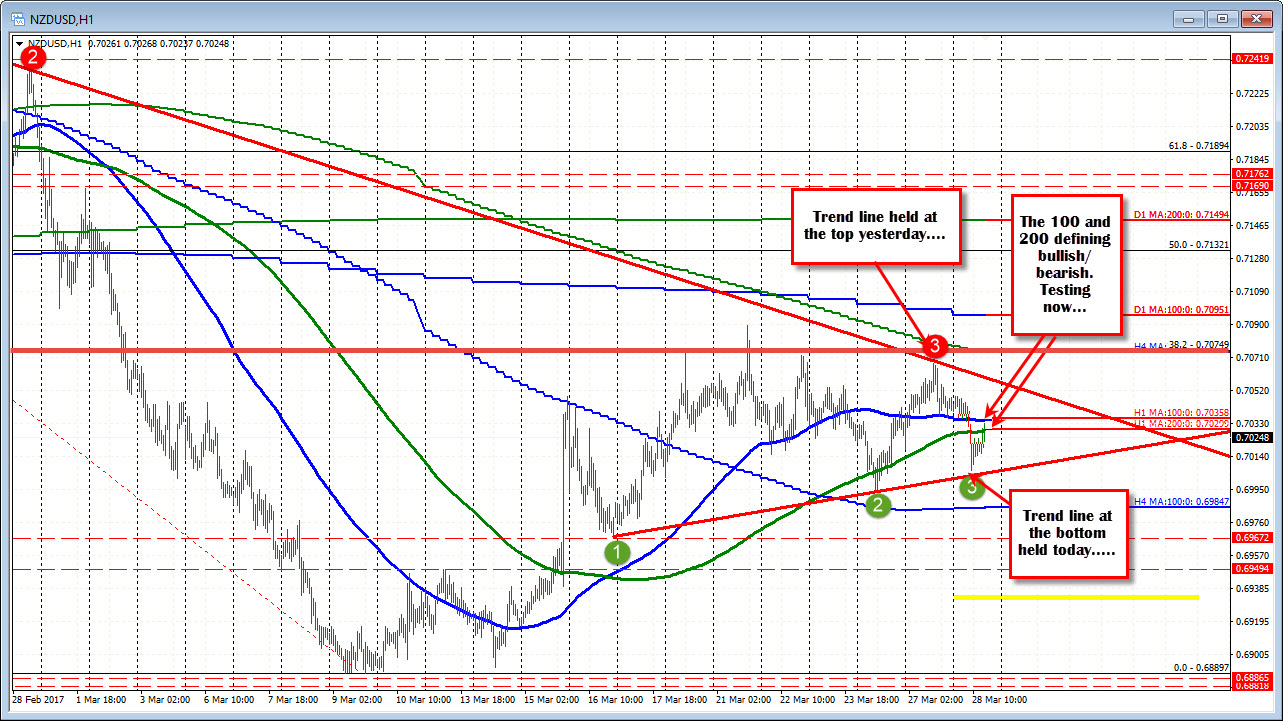
Drilling to the hourly chart, the pair is up testing what should be a resistance area. Looking at the chart, the pair tested a topside trend line yesterday (extends back to Feb 7th high). Today it tested a lower trend line . Each are defining a consolidation range for the pair. IN between sits the 100 and 200 hour MA (blue ad green lines). We trading above it yesterday. We are trading below it today. Those MAs are being tested now. Stay below keeps the sellers more in control and we may see a break of the lower trend line. Move above, and the buyers from the below may/should have the help of more buyers. The topside trend line would be the target to get to and through.
The up and down nature of the market price action is saying "Not sure what to do down at these levels". That is ok. The market is figuring out which way it wants to do. Nevertheless, pay attention to the extremes and you may catch some mini moves that take the price from one level to the next level.

