
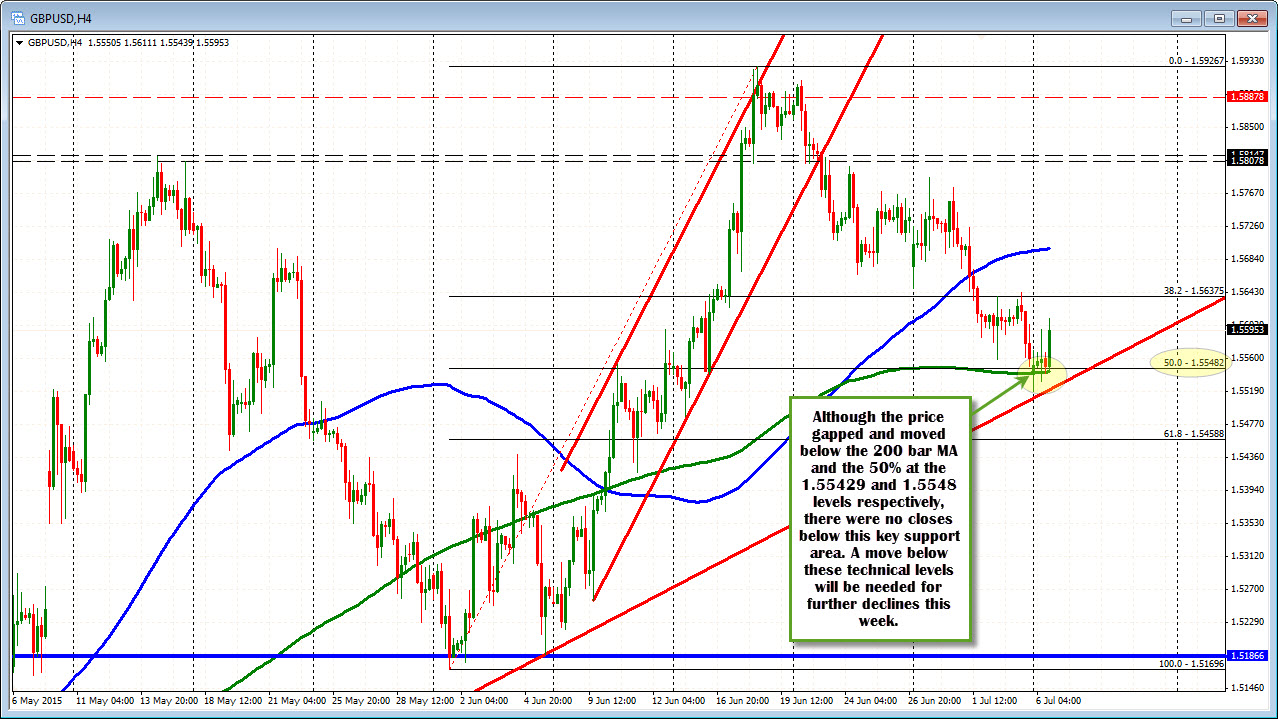
Moving averages defining the range perhaps?
The lows in the GBPUSD today fell below the 50% of the move up from the June 1 low at the 1.5548 and the 200 bar MA on the 4-hour chart at the 1.55429 level (currently). However, there were no closes below the two support levels and the price has rebounded. For the week, I am putting a line in that area and daring the sellers to get and stay below that level.
On the topside, the levels I will be eyeing will be 100 hour MA which currently comes in at the 1.5621 level. The price last tested this MA on Wednesday before moving sharply to the downside. Prior to that, the market used the 200 hour moving average (green line in the chart below at 1.5672 currently), as the topside resistance ( see green circles in the chart below). That MA will be in play if the price is able to extend above the 100 hour MA today/this week.
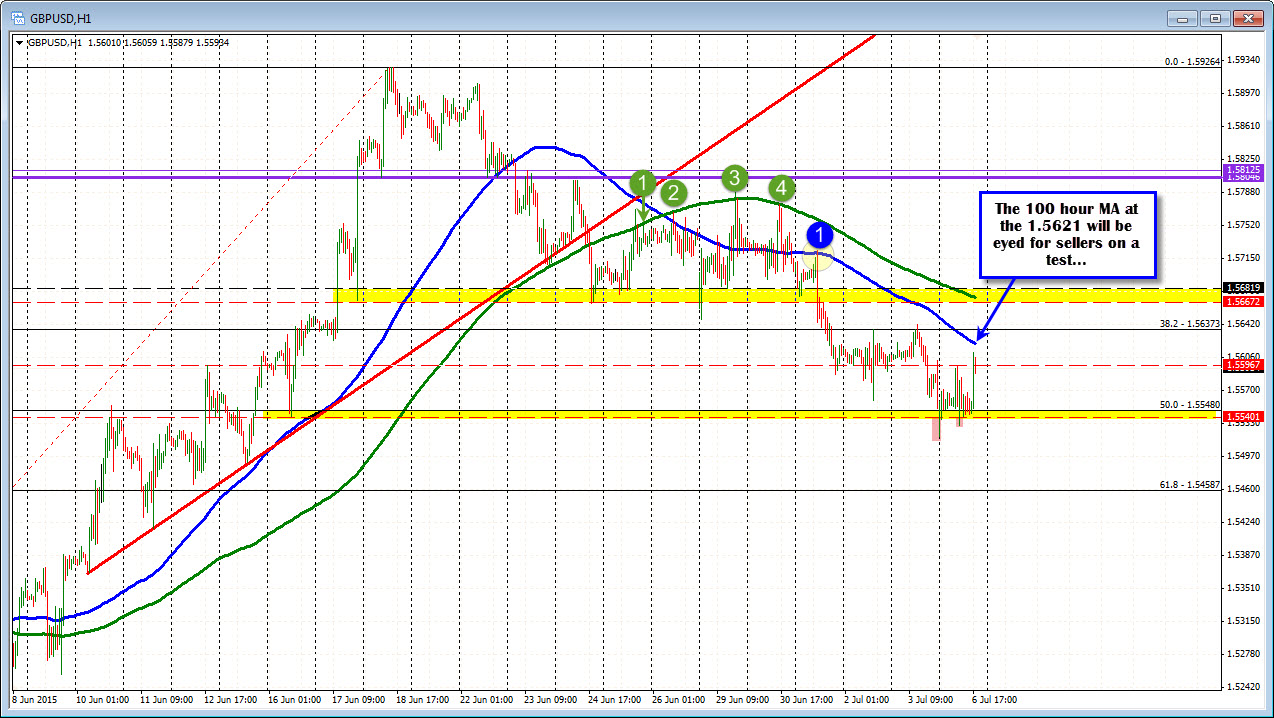
For the time being, look for patient sellers to wait for a test of the 100 hour MA. The market seems to be cautiously moving about and I think that supports patient plays where risk can be defined and limited.

