
Traders keeping the pair contained
The GBPJPY has been consolidating trading with little in the way of a definitive technical bias.
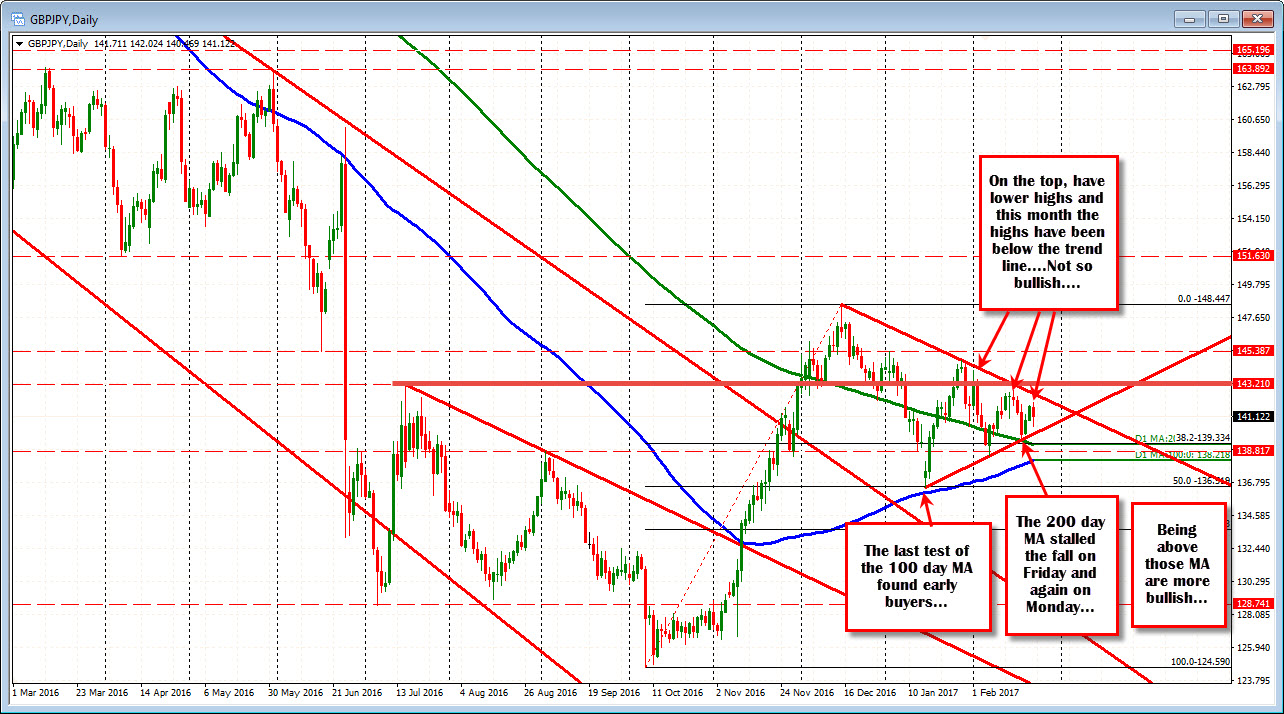
Looking at the daily chart, the par over the last two months has traded above and below the 200 day MA (green line in the chart above). The price has been above the 100 day MA since election time in November. The last test of the 100 day MA stalled just above it in January. The last test of the 200 day MA stalled just above it just last week (and on Monday too). So that is bullish.
BUT...
The recent high in December has been followed by successively lower highs. The highs this month have been below the trend line off the Dec and end of January high.
So if I were to characterize bullish or bearish solely on the daily, it is more bullish but there is more that is needed.
Drilling down to the 4 hour chart, the same trend lines are in play (see chart below). There is some support at the 140.43 level ahead of the lower trend line. There is some resistance at 142.15 before the topside trend line at the 142.41 level.
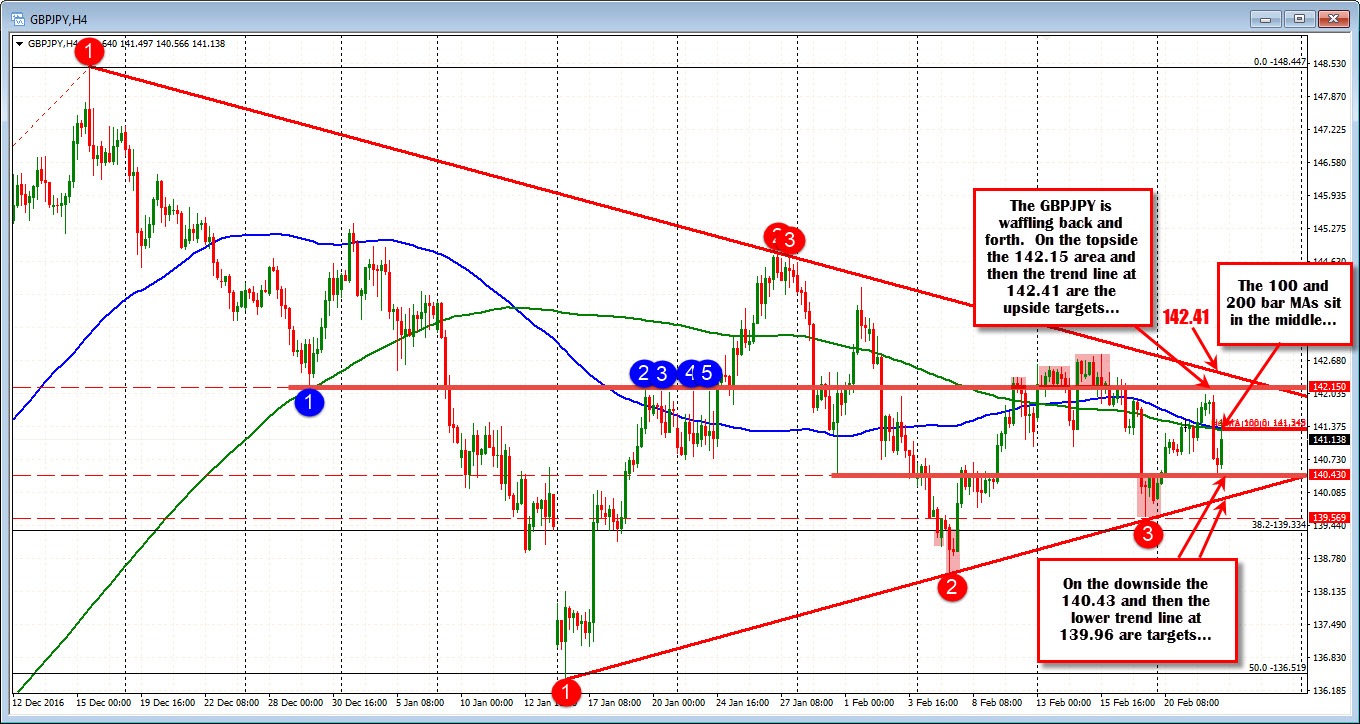
In between sits the 100 and 200 bar MAs. They come in at 141.34-35 area (blue and green lines in the chart below).
This week the price trades above and below those MA lines - including today. We are currently trading below which is a bit more bearish. If we are going higher we need to get and stay above those MAs.
The technical picture is showing a market that is not sure what it wants to do and the ranges are converging as a result.
That is the bad news.
The good news is that the spring is getting tighter in the convergence of the technical levels. So we can look forward to a break at some point.
Watch the 100 and 200 bar MA for clues. We need to see momentum on breaks though. Also watch the interim level ahead of the trend lines. They should give traders a clue too..

