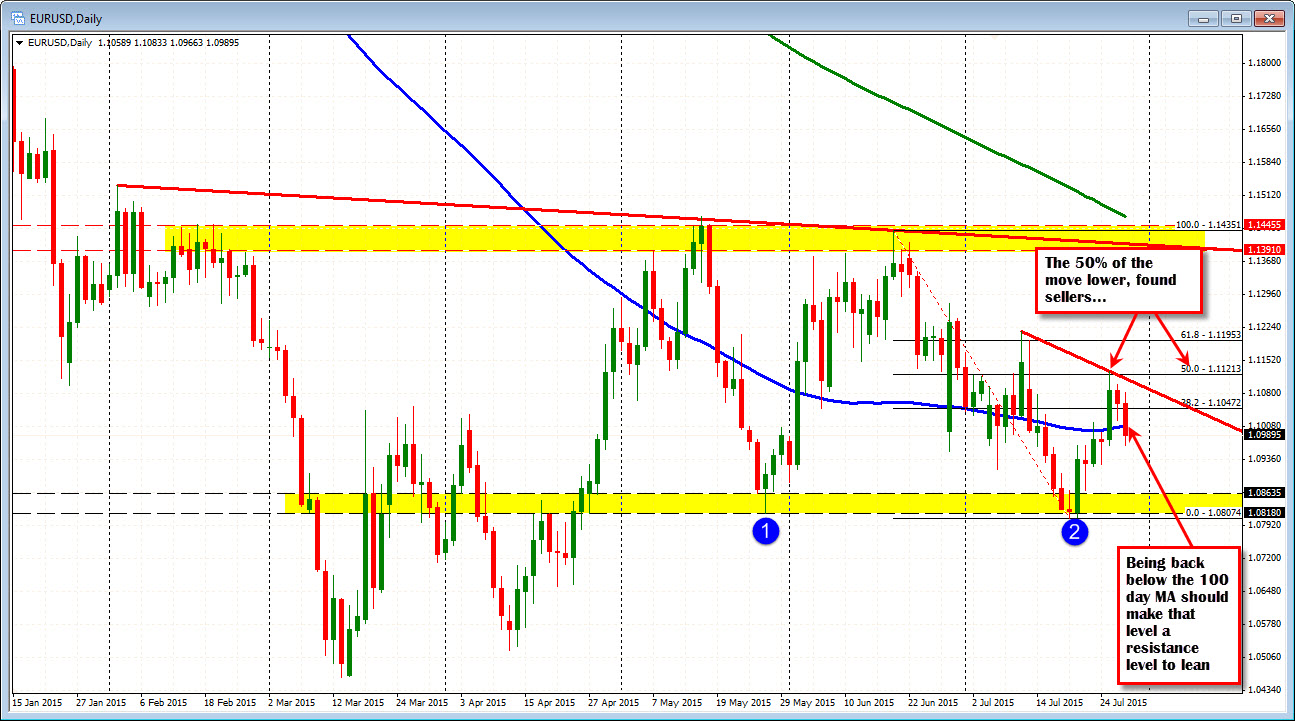
Market shifts below 100 day MA. Can it stay below?
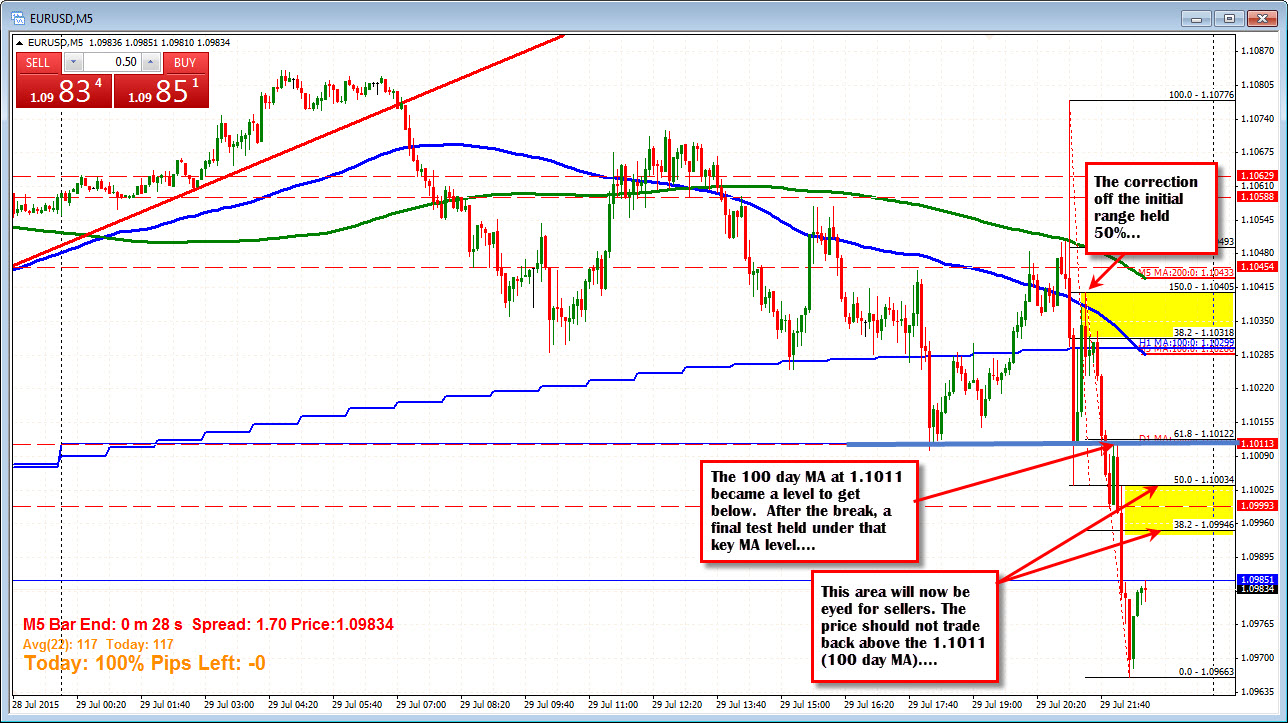
The EURUSD had an up and down time of it for the first 45 minutes of trading after the FOMC statement. The correction off that move (up to 1.10776 and down to 1.10034) held the 50% at 1.1040 (see chart below). The next fall below the 1.1011 (100 day MA) turned the bias back lower (see price action on the 5 minute chart below)
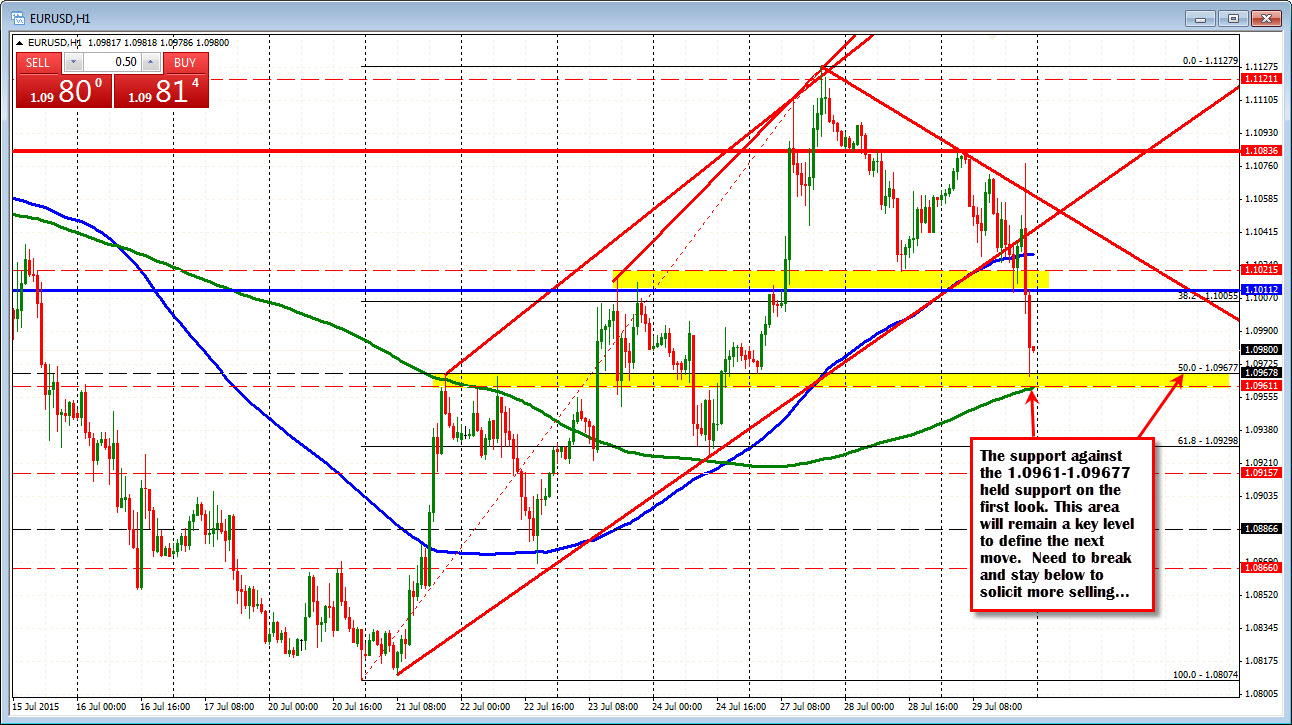
The target?
The 200 hour MA and 50% retracement of the move up from July 20 low comes in at the 1.0961-677 area. The low for the day came in at 1.09663 (see chart below) and held. Buyers showed up where they should have shown up. To go lower in the new trading day, this area will need to be broken and the price stay below.
What if the price extends back higher? The retracement of the move down from the first corrective high at 1.1040 comes in at the 1.0994 to 1.0003 (see 5 minute chart above). That area - should find willing sellers if the sellers love the downside.
Also above is the 100 day MA. This MA (at 1.1011 area) should now be a "Line in the sand" for the EURUSD.
As a review for the week....On Monday, the price moved higher, but stalled near the 50% retracement area.
On Tuesday, the price moved lower, but trading was slow.
Today, the price extended back below the 100 day MA.
So stay below the 100 day MA and the bears remain in control. Move above and the waters get muddy again.