100 hour MA and 200 bar MA on 4-hour chart
Yesterday, the EURUSD moved above that 200 bar MA on the 4-hour chart, after finding support near the 100 hour MA (blue line in the chart below). That break turned the bias further to the upside and although the action as more sideways in the NY afternoon session yesterday, the range was extended higher in the Asian Pacific session.
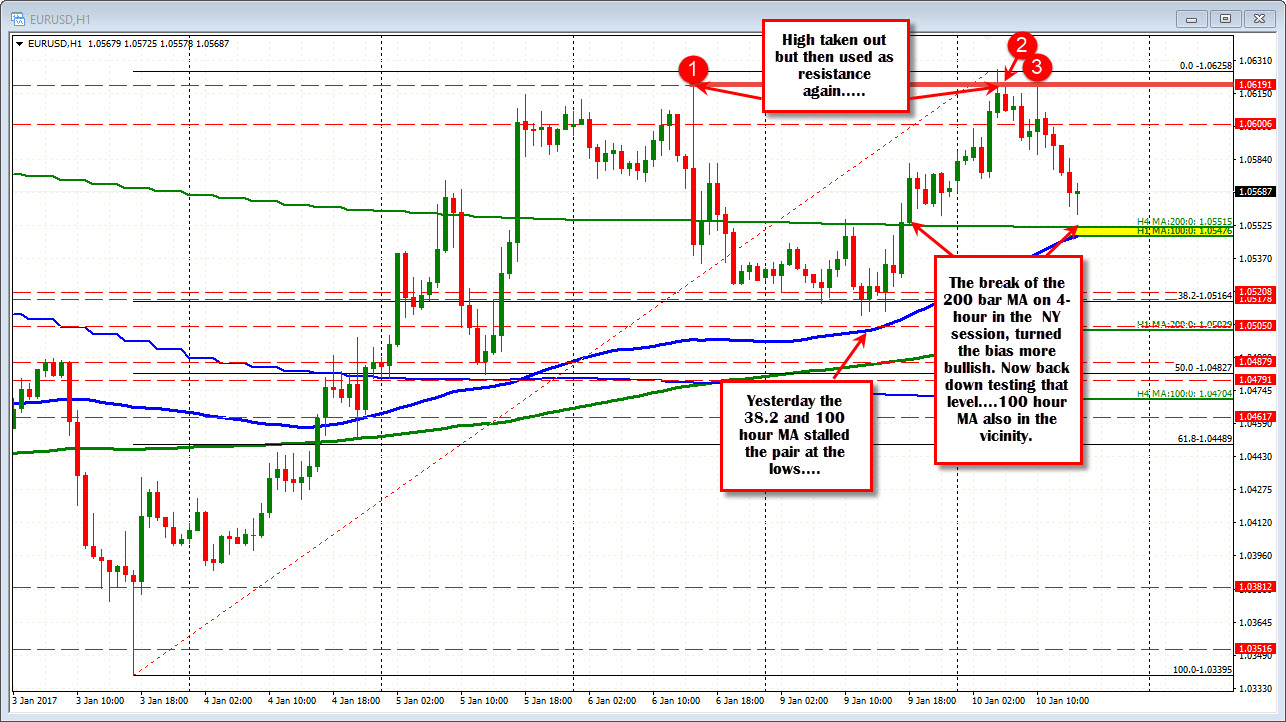
The prior high from Friday at 1.0619 was broken but momentum started to fade and that level started to cap the upside. The last 5 trading hours has seen lower closes on the hourly bars.
The move lower, has taken the price back down toward the place where it all started yesterday - the 200 bar MA on the 4-hour chart. That MA comes in at 1.05515. The low reached 1.05578 in the current bar. In addition, the 100 hour MA (blue line) has caught up to the price and stands at 1.05476 (and rising). What was once resistance yesterday became support. Now we retest that support. Traders have leaned on the first modest test. That makes sense as traders trading the price action and levels, take profits (or try the long side against support). There is little in the way of economic data to influence the action so traders can trade the ranges/technical levels.
Understand, however, that should the level be broken, I would expect a rollover back to the downside - with a retest of the 38.2% at 1.0516 the next target.
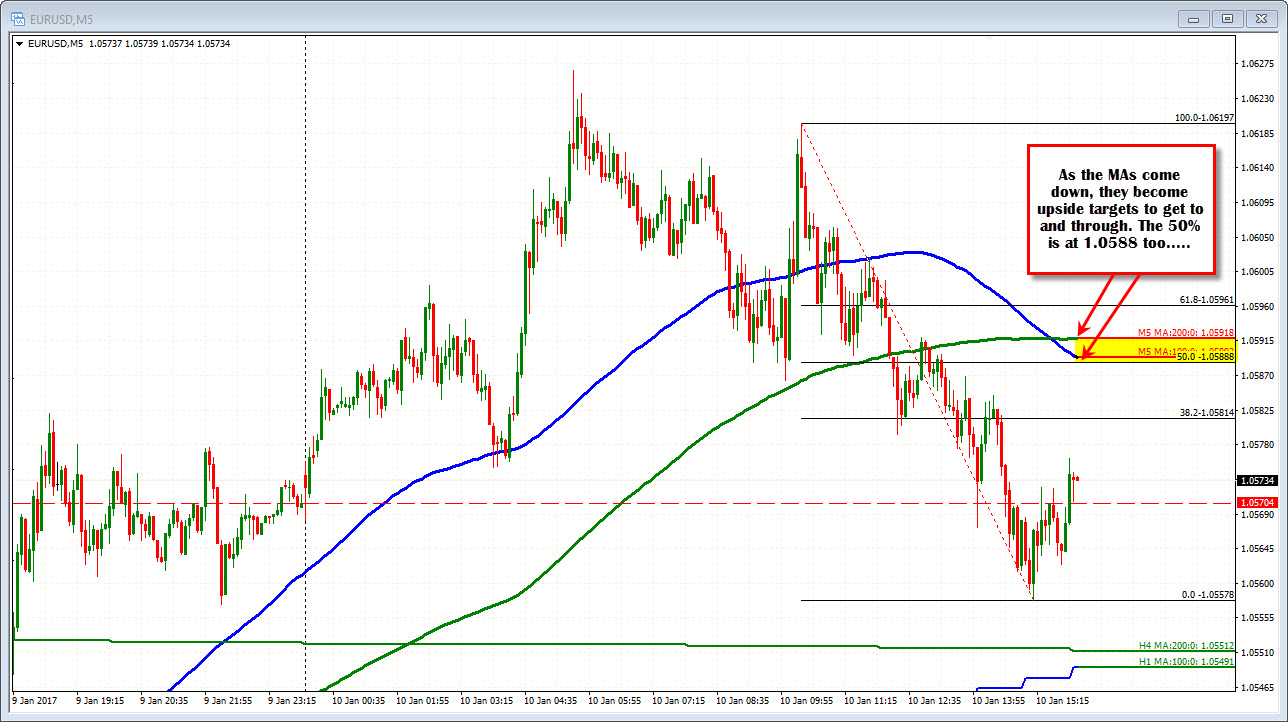
The close yesterday was 1.05704. The pair has traded below that level and currently trades a little above. Watch that level for close clues for an intraday bias (stay above more bullish/move below more bearish). Buyers from below want to see gains. That is one level to level to get above. . The 50% of the last trend move lower and the 100 and 200 bar MA on the 5-minute chart are at 1.0588-92. If the buyers love this dip, that area will need to be taken back (with a break back above).