100 hour MA, 200 hour MA, old trend lines. All broken.
The EURJPY has tumbled lower in trading today and in the process knocked out the 100 hour MA, 200 hour MA, an old broken trend line (see blue line and blue circles), and - with more trouble - a horizontal "remembered" line that was defined by swing highs and lows (see red circles).

The fall below the 120.20 level enters an extreme area that saw up and down trading on Feb 7th to Feb 9th. Traders will use that level as resistance now (risk level for short). The lows will be the targets now.
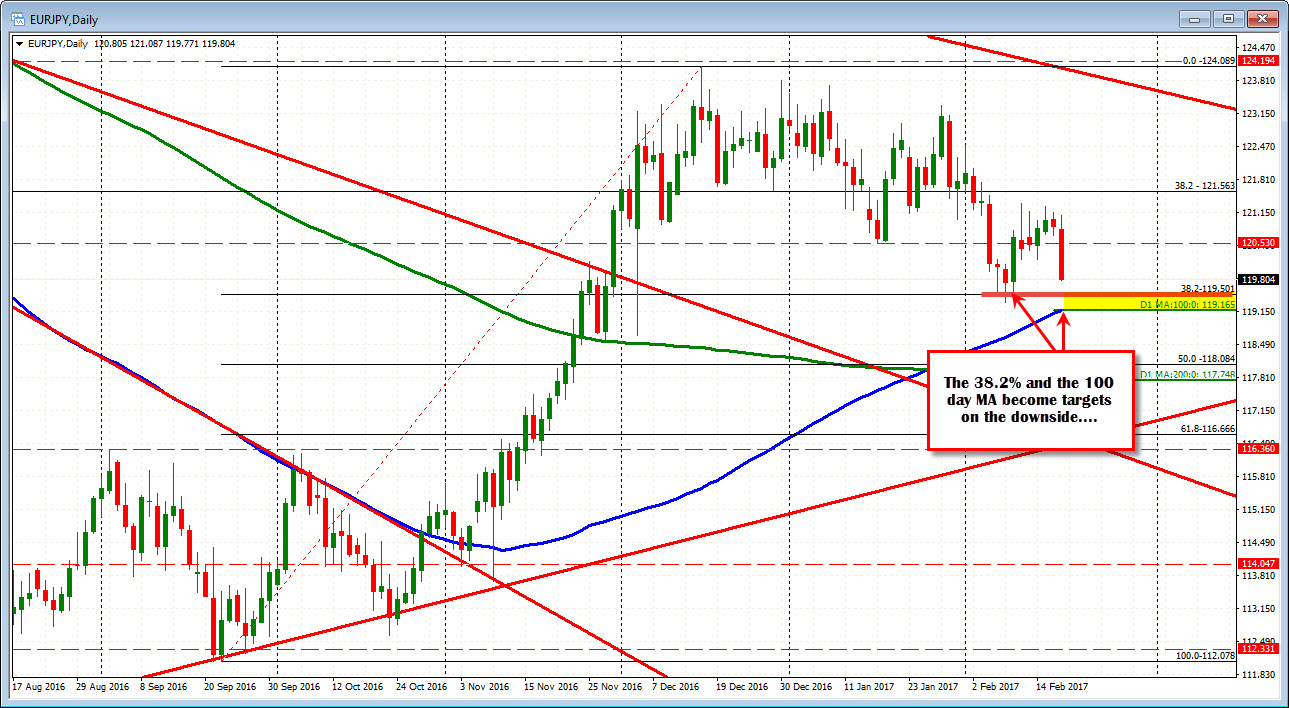
Looking at the daily chart below, the 119.50 level is a key target on the downside. The level is the 38.2% of the move up from the September 2016 low. The swing lows from Feb 7th (119.53) and February 9th (119.507) make that a key level. The 100 day MA at 119.17 will also be a level to eye on the downside.