78 years ago today, the Hindenburg crashed:

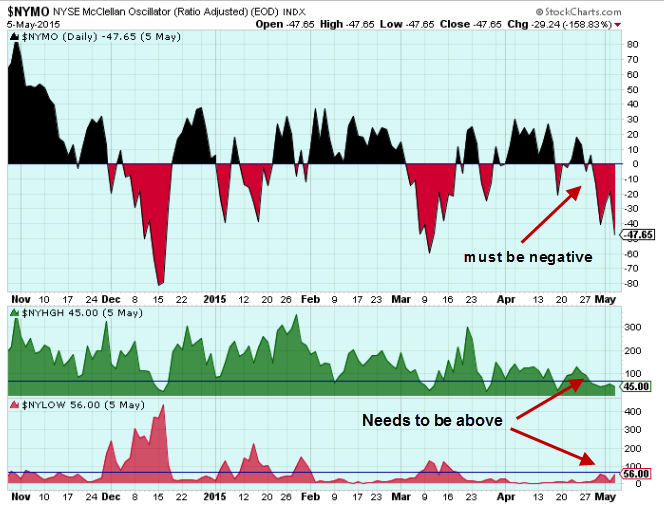
From time to time, there is a buzz in stock markets about the Hindenburg omen. It's a stock market technical indicator that happens when the ratio of new highs and new lows compared to the total number of issues on the NYSE is above 2.2% (or 2.8%) and the McClellan Oscillator is negative. A final caveat is that the NYSE 10-week moving average is also rising.
At the moment, it's all clear.
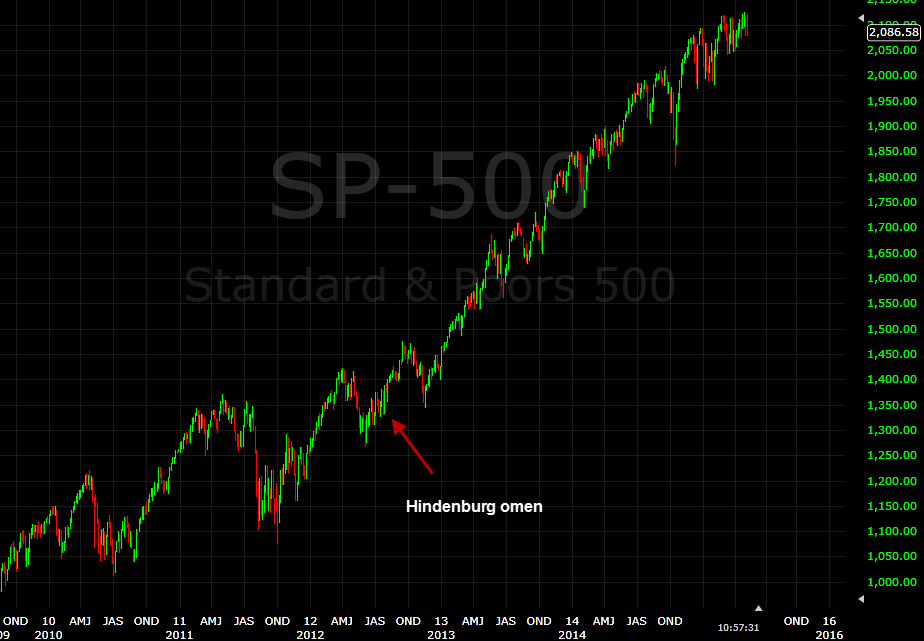
In any case, the track record lately is patchy. The last time it was a buzz word was July 2012 and here's what happened to the S&P 500 afterwards.