Approaches retracement resistance and underside of broken trend line
The USDJPY is trading at the session highs above the 120.00 level. The pair has been benefiting from the higher dollar, and perhaps month end/quarter end/Japanese year end flows.
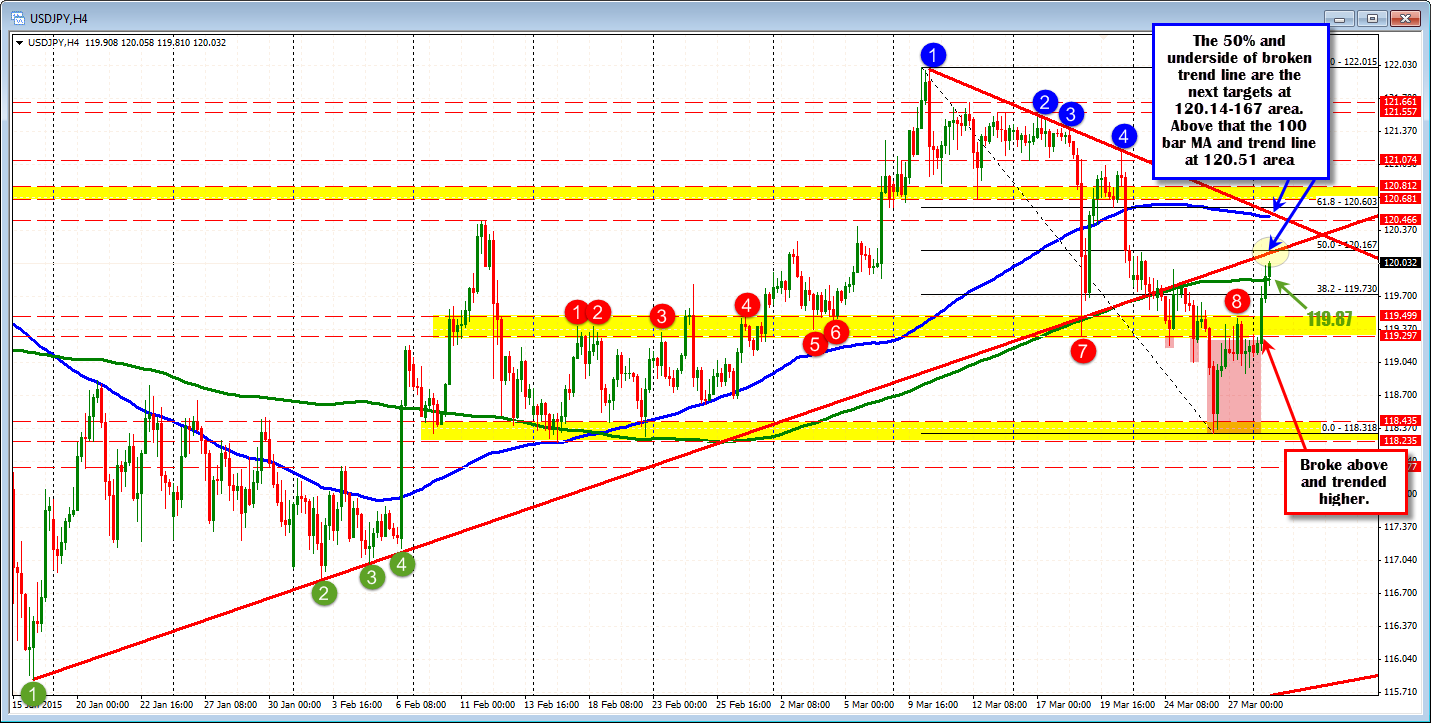
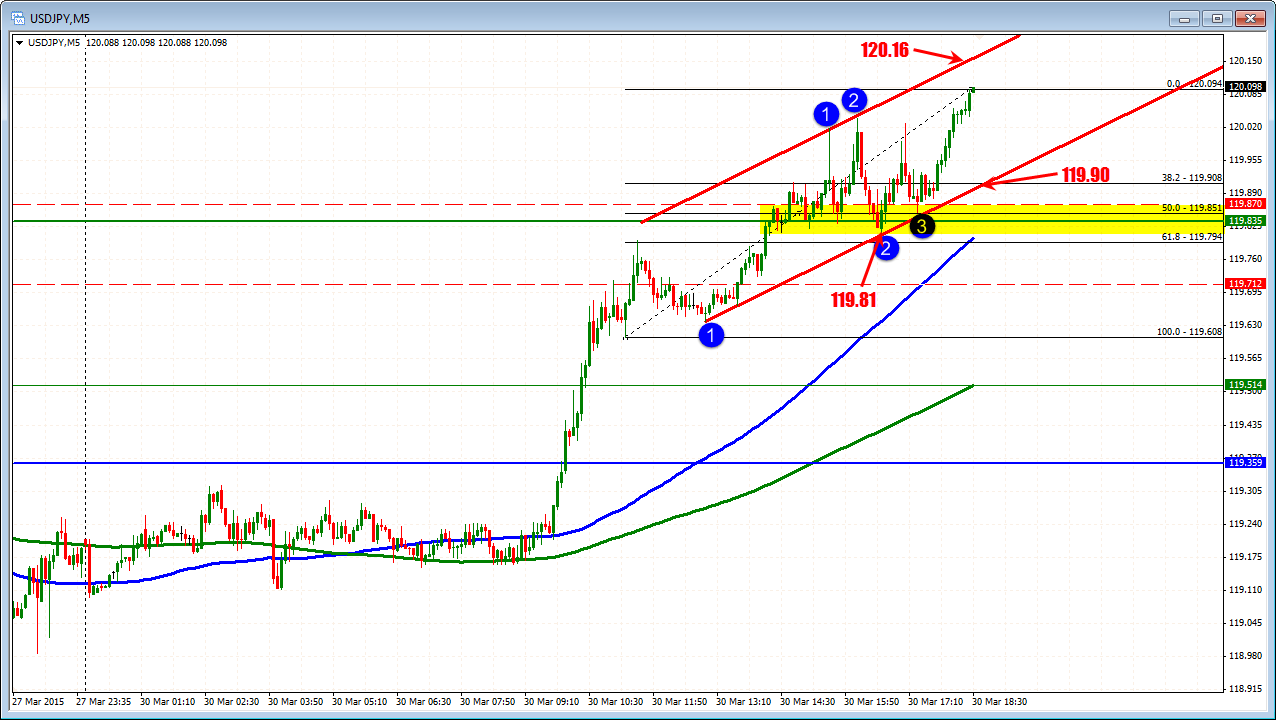
Technically, looking at the 4-hour chart above, the pair moved above the 119.29 – 119.49 swing area (there have been a number of highs and lows against this area) and trended higher. The pair has moved above the 200 bar moving average at the 119.87 level (see green MA line in the chart above) Corrections have been limited to 119.81 (see 5 minute chart below) There is topside resistance approaching on the 4 hour and the 5 minute chart at the 120.16 area. Both are trend line levels. On the 4 hour chart, the line is the underside of a broken trend line. On the 5 minute chart, the trend line represents a topside channel line. The 50% of the move down from the March 10 is also at the level. The combination of resistance levels should be cause for pause for the buyers. Look for profit taking sellers to lean against the level with stops above.
On the downside, the lower channel trend line on the 5 minute chart comes in at 119.90 currently (and moving higher). This and the 119.87 level from the 4 hour chart (200 bar MA on the 4 hour chart) should be a line in the sand for the pair on the downside. Can the buyers continue the push higher? If so, the 120.37 followed by the 120.50 area (100 bar MA on 4 hour chart and the topside trend line) is another key level.