Yesterday, the prices of the major currencies closed below the 100 day MA. Where are the 200 day MAs?
As reported yesterday, the major US indices closed below their 100 day MAs yesterday for the first time since November 2016. What above the 200 day MAs? Where are they now?
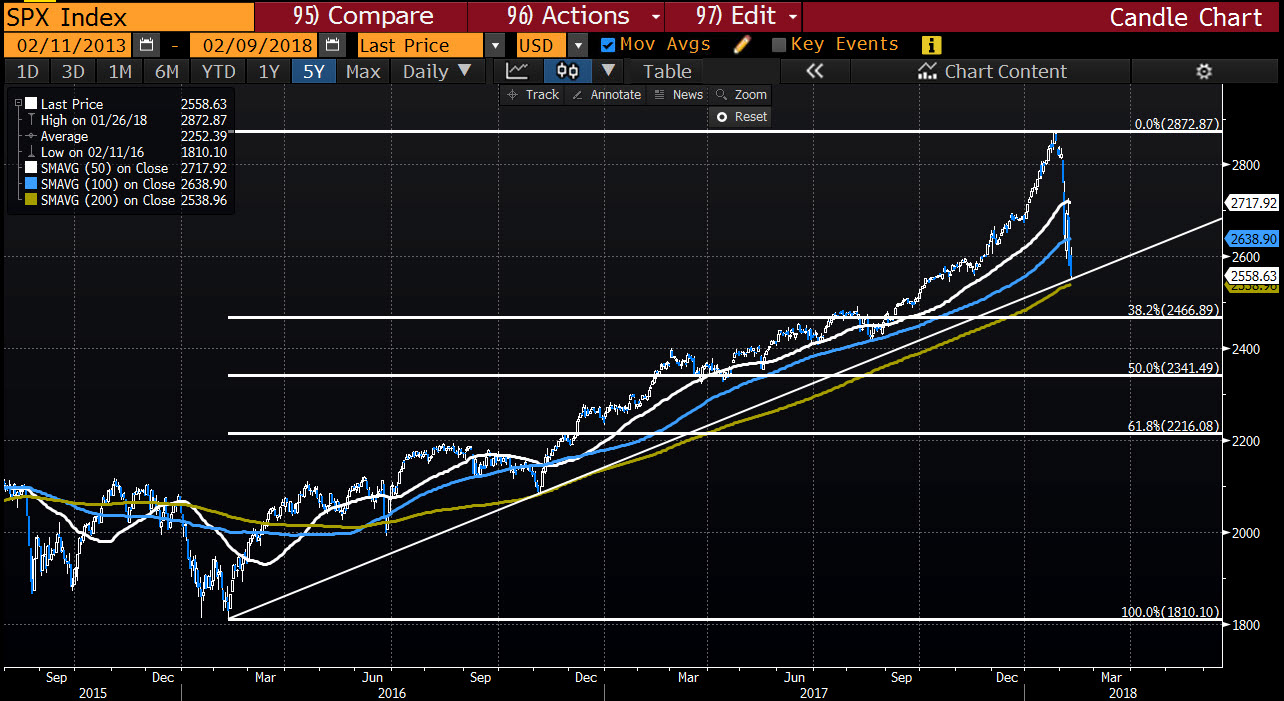
As Adam pointed out, the S&P is fast approaching its 200 day MA. It comes in at 2538.96. The low price just reached 2547.78. That is the closest of the majors with only a 0.35% move from the low to reach that level.
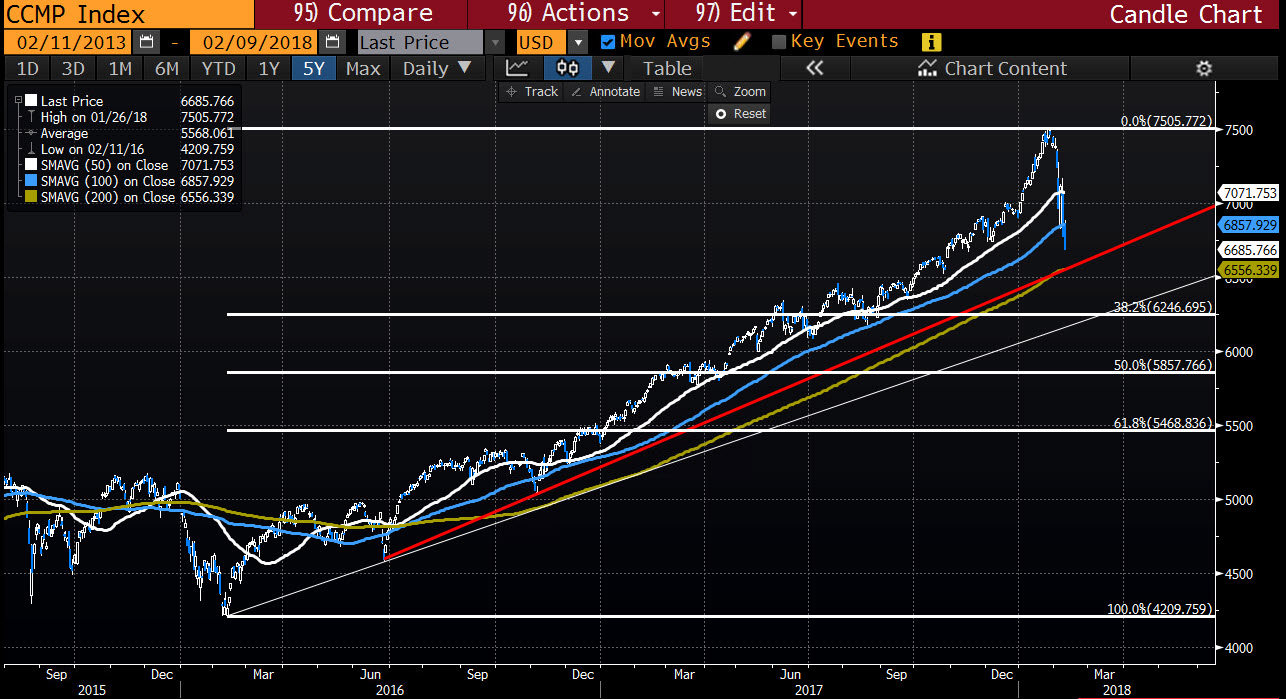
The Nasdaq 200 day MA comes in at 6556.33. The low just reached 6670.14. So we are 144 points away still. That equates to a 2.1% decline from the current level. The Nasdaq is predominantly a tech play which got one of the biggest boosts in 2017.
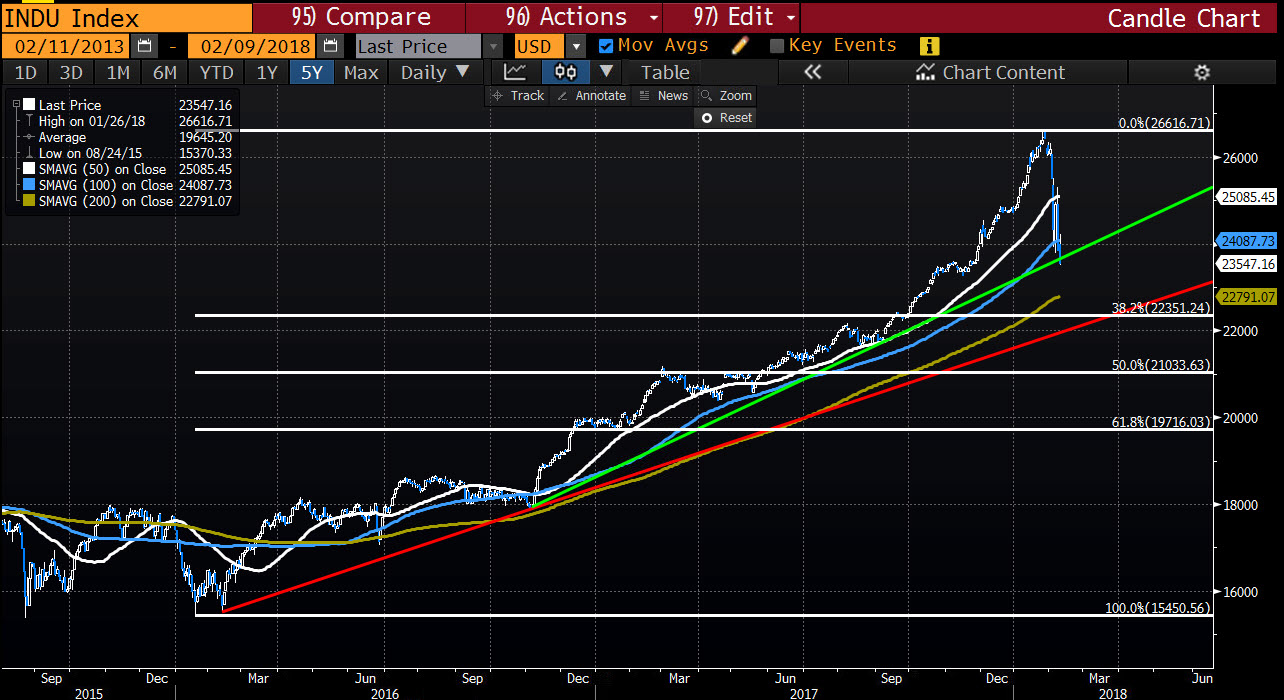
The Dow 200 day MA comes in at 22791.07. The low reached 23497. We are 705 points from the lows to the MA level. That would be another 3% decline. The Dow average is largely influenced by high priced stocks like Boeing, Goldman, 3M, United Health, Home Depot. If they start to go more, the index comes down faster.
There are other technical levels in play like trend lines and retracements (see charts).
Needless to say, there is a lot of fear in the markets right now.
After the debt auctions this week, what is concerning is the that market has been influenced by debt, and rates. This week, the budget deal passed is projected to increase the deficit by $320 billion.
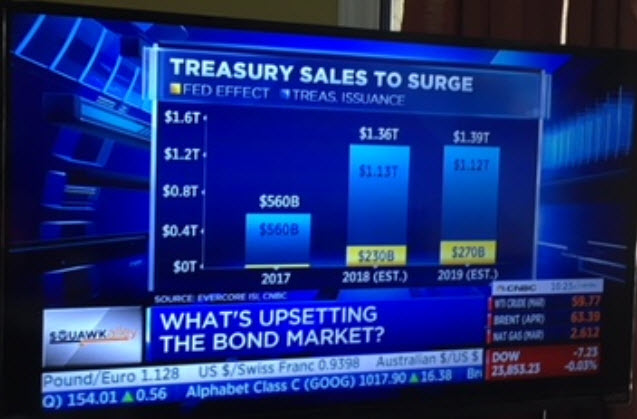
Steve Liesman on CNBC had a report earlier today that showed the US Treasury sales are to surge in 2018.
By comparison to 2017, the US had 560B of issuance. Evercore (his source cited), are projecting $1.36T of issuance. That is a BIG increase (like more than double).
This week, the auctions were middle of the road at best. There were tails to WI levels and the bid to covers were not great either.
If the supply only gets worse, it makes you think about the demand and what that does to rates. Rates has been the stock markets boogeyman this week.