
Risk sentiment in European and US trading is going to play a big part in seeing if support levels hold
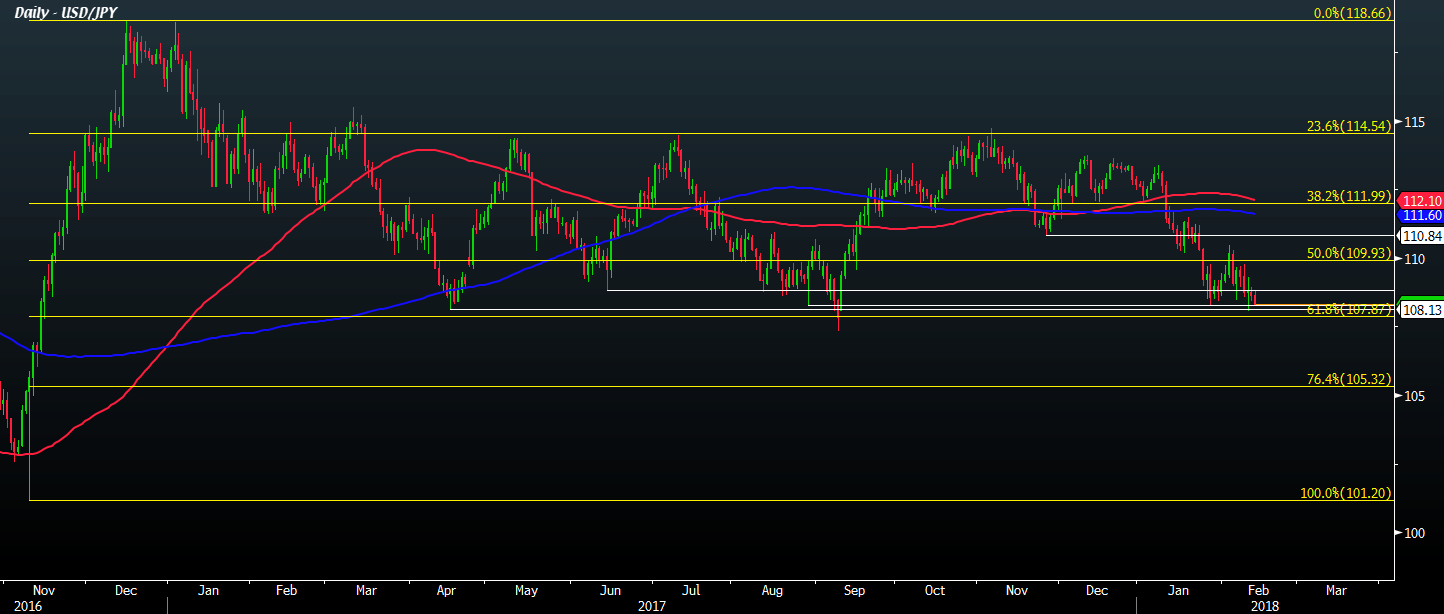
The daily chart for USD/JPY shows a very clear picture of how the pair has been trading since April last year. It's between a range 108.00 - 114.50, with the exception of a minor break below the 108.00 in September last year (but held up by the 61.8 retracement level support at 107.87).
The Nikkei has turned negative, and in fact now extending losses as we head towards the end of the session - down by 0.51% at session lows. That has put some pressure on USD/JPY as we see it trade to a low of 108.24 on the day.
The low posted this year was at 108.05, though broader bids are surely sitting near the figure level. It's going to be a trade on risk sentiment if we are to see the pair finally break out of this range, so watch out for how equities are performing later on in the day.
The only bright spot for risk trades is that this seems like an isolated incident to the Nikkei thus far. The Hang Seng index and China's Shanghai Composite and CSI 300 indices are still holding onto gains on the day. So, a full on risk aversion trade is not in motion just yet.
--
Savage crash - RIP Cryptocurrencies? Five insights from the ASAC Fund.

