
A look at the weekly oil chart
Oil gained 24-cents to $42.97 on Friday but finished the week lower by $1.76, or 4%. It's the fifth consecutive week of declines for crude since OPEC announced a one-year quota extension.
At this point, it's safe to say that OPEC didn't do enough. They overestimated how much shale and Libya was capable of producing. They also may have underestimated just how much oil was in storage.
Let's take a closer look at the long-term technicals.
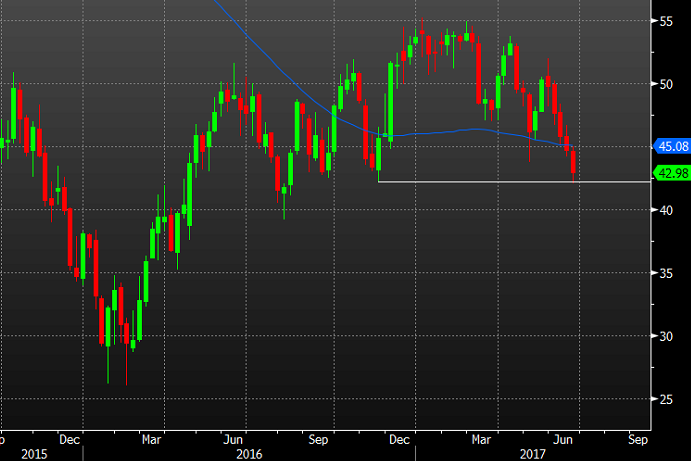
The main recent feature on the weekly chart is the close below the 100-week moving average for the first time since December. Oil tried to climb back above it on Monday but was flushed lower and briefly broke the November low.
Was it a true break? The November low was $42.20 and the intraday low this week was $42.05. That's a significant break but the lack of a daily or weekly close below makes me believe a bounce here is more likely, even if it's only a shallow one.
Fundamentally it's a different story. What impressed me this week was that oil fell despite a tighter US inventory report and despite some strong OPEC jawboning. The lack of upside on those stories is troubling.
Yet one story looms largest: Saudi Arabia. Bin Salman consolidated power last week and today the kingdom gave Qatar 10 days to meet an impossible 13-point ultimatum. Saudi Arabia also said it wants $60 oil. It could get both with a war. Unthinkable? Maybe not.

