
Traders like breaks off lows (and perhaps a little failure)
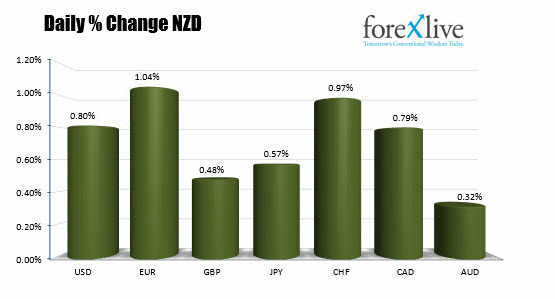
The NZD is the strongest currency in trading today. Looking at the % changes of the major currencies vs the NZD, the EURNZD is now the biggest % mover at 1.04%. The NZDCHF has a 0.97% change. The NZDUSD is up by 0.80% on the day. Not a bad run.
The greenbacks decline has helped the NZDUSD pair in the NY session continue the trend higher. In the process, the technicals also contributed.
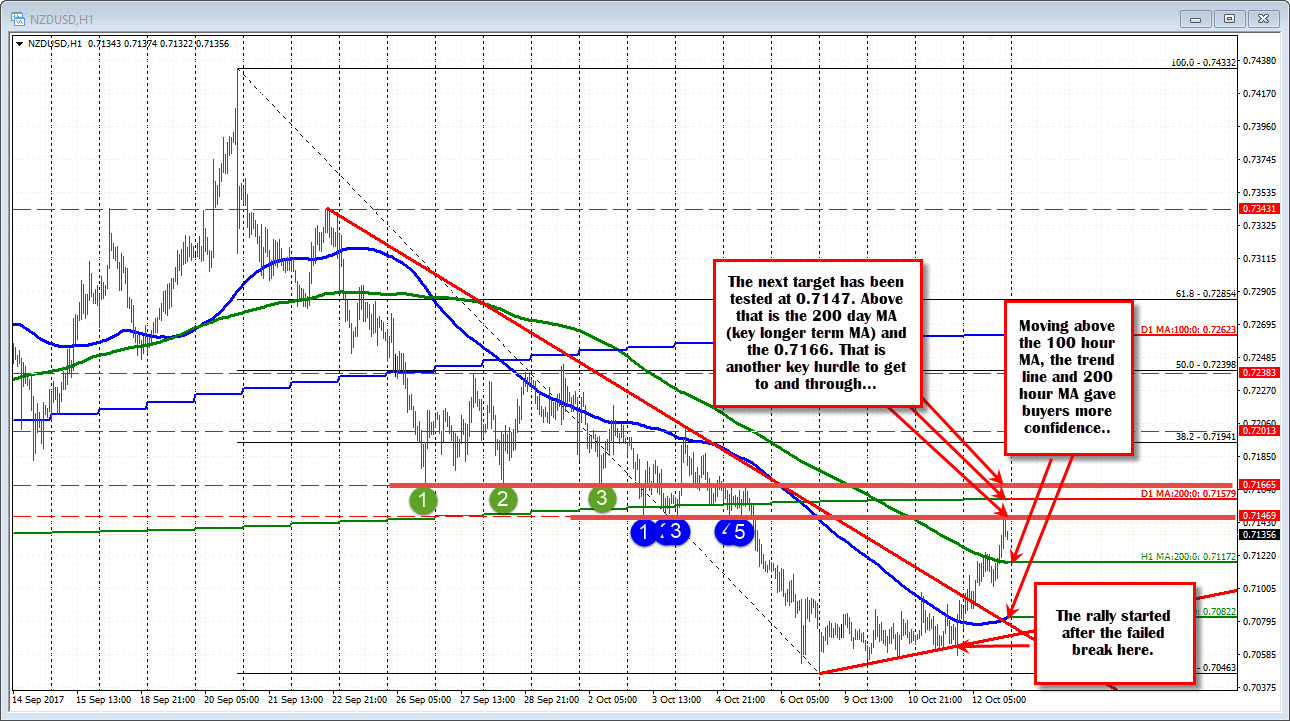
Looking at the hourly chart, some bullish clues are evident.
- Yesterday, there was a break below a lower trend line. That break failed and it helped start a move higher and above the 100 hour MA into the close.
- A trend line was broken next in the early Asian session. The price action was up and back down, but dips were bought.
- The testing of the 200 hour MA in the London session stalled the rally. The 200 hour MA had not been busted since September 25th. That was 13 trading day's ago over which time, the MA moved from 0.7290 to 0.7117. Nevertheless, the first test of the 200 hour MA after an extended trend move, is typically a tough nut to crack. That was the case in the London morning session
- Finally, after a modest correction, the 200 hour MA was broken at 0.7117. The price moved up to 0.7145.
Traders who gave the benefit to the corrective action and clues, profited.
What now?
What was resistance becomes support. So the longs off the hourly chart will likely use the 200 hour MA as the line in the sand/Risk defining level. The break higher suggests buyer are started to take back control. A move back below would not be indicative of a "market" that is more bullish.
On the topside, the momentum has some key hurdles that are a concern:
- The 0.7147 level was home to swing lows on October 3rd, 4th and 5th. On the 5th, the price broke below that floor and stayed below. Today we moved up to 0.71452. Could that be the top? Yes. Some traders today, leaned against that level and either took profit or shorted. I would expect stops on a break above that level thoush
- The other key level is at 0.71579. That is the home to the 200 day MA. Although on the move lower, the price of the NZDUSD traded above and below that MA line on the 3rd, 4th and 5th, the market consolidated mostly above the level. Getting above that level would increase the bullish bias
- The 0.71665 is a final hurdle to get to and through. That level was a floor on Sept 26, Sept 28 and October 2nd. On October 5th, after a waffle above and below on Oct 3rd and 4th, the market traders started to lean against the level and push below the 200 day MA.
When a bottom may be in place and traders start to correct, there tend to be a number of hurdles to get to and through. You will get day's like today where the trading bias shifts around, but you must also be aware that it is just a day and there are levels to get "to and through". Nevertheless, the road map is clear and layed out. It is a matter of staying above broken levels and reaching targets if trend is to continue.
If the corrective move fails or you want to sell a rally, pick a spot to lean against above - like the 200 day MA - and lean against it.

