
A technical explanation
The GBPUSD has had its ups and downs today. How do you make sense of it.
Technically,
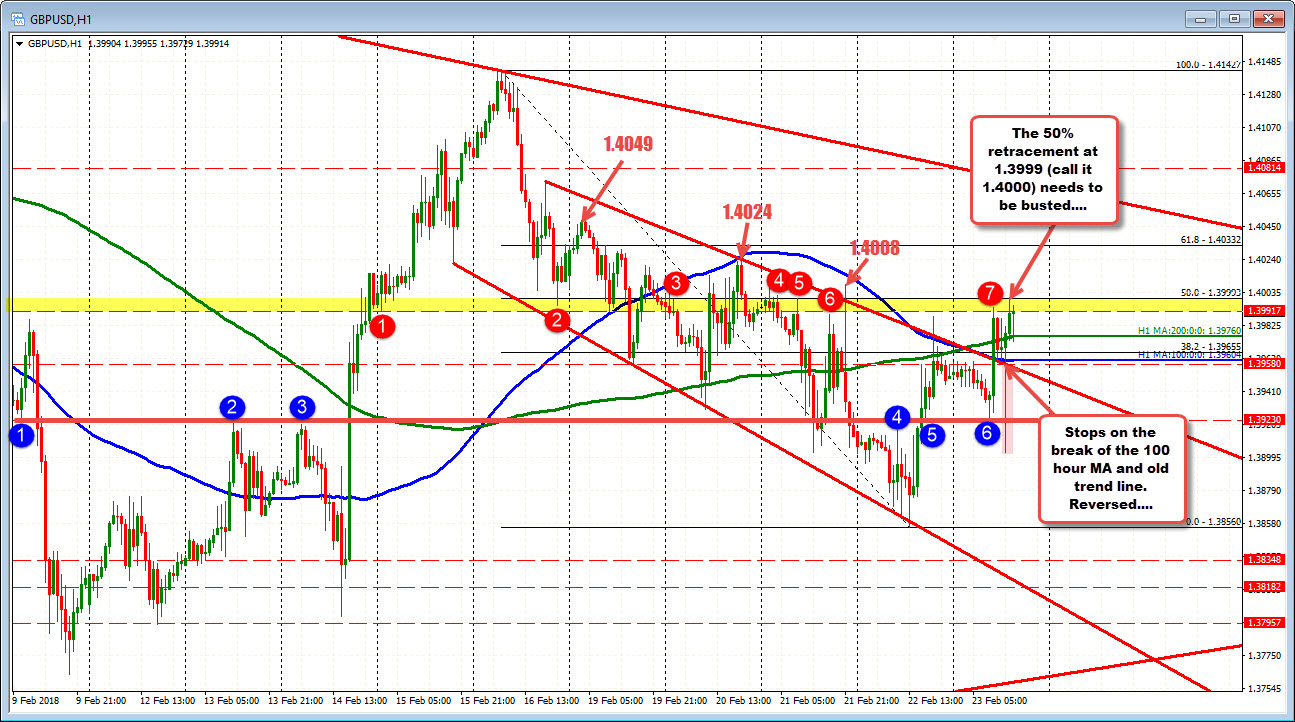
- the pair was able to get back above the 100 hour MA and an old trend line in the earlier London session.
- The price climbed toward the 50% retreacement level at 1.3999 and backed off.
- The 100 hour MA and old trend line was retested.
- Then the level was broken. Stops triggered. The price tumbled lower.
- The price fell below the 1.3923 key swing level and failed. Buyers come back in
- The move back above the 100 hour MA (which is really the tool followed by the traders today), gave the buyers the advantage again.
Now although the buyers have an advantage , there is a caveat. The 50% continues to hold the topside resistance. The fact that it comes in at the 1.4000 level (a natural technical level) helps too.
So there is a battle with the 100 hour MA below and the 50% retracement above. The price trades in between just above the 200 hour MA. That may also be a level to eye for bulls. Stay above and that push higher may be able to get above the 1.4000 level.
The high from Wednesday at 1.4008, the high from Tuesday at 1.4024 and the 61.8% at 1.4033 will be targets. The high from Monday reached 1.4049.

