Fails to extend above resistance target yesterday. Wanders lower today.
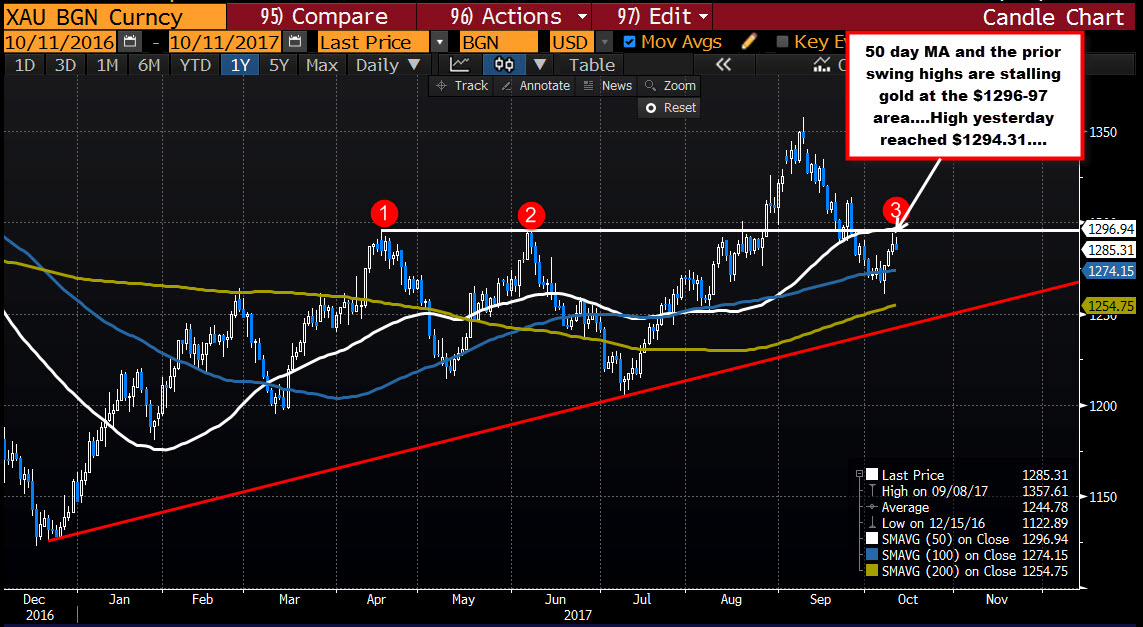
Yesterday, gold moved up for the 3rd day in a row. However, the precious metal approached a key technical target at the $1296-97 area. Looking at the daily chart below, the area is defined by swing highs April 2017 and June 2017. The 50 day MA also cut across at the area. The price backed off and closed at $1288.03.
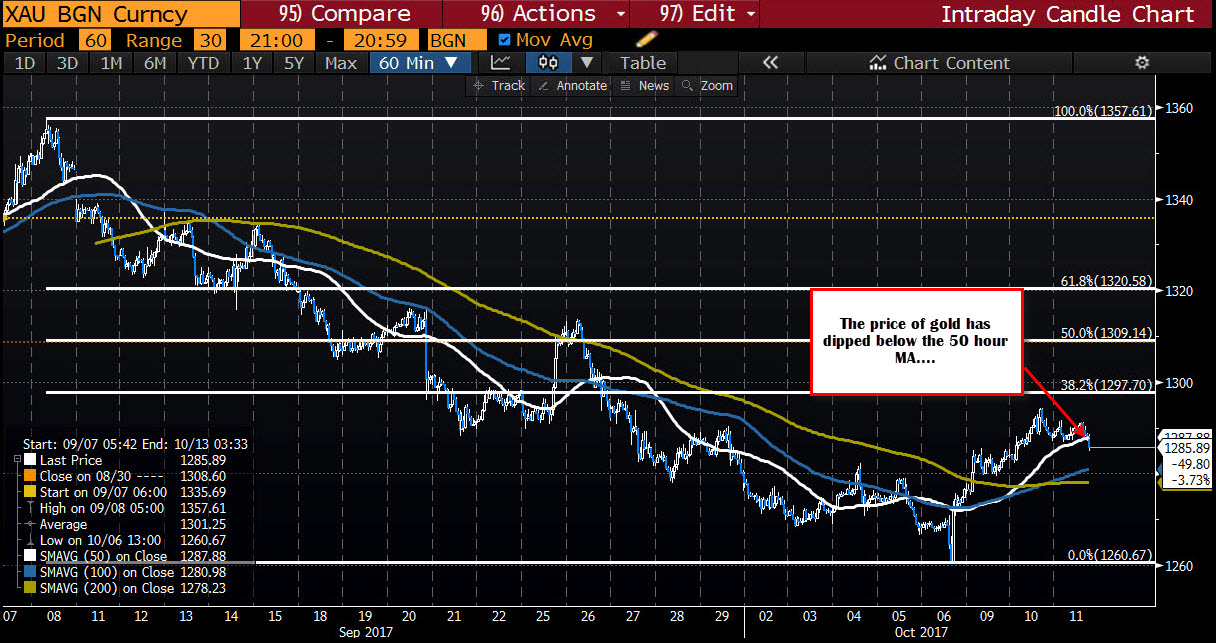
Today, we are seeing the price move higher and lower. The high today reached $1291.76. The low has now extended down to $1284.84 - new session lows and back down on the day.
In the process, the contract has dipped below the 50 hour MA at $1287.88. That is now close risk for shorts.
The buyers took a run at the key resistance but turned to sellers against the risk defining level. The 100 and 200 hour MAs at 1280.98 and 1278.23 are lower targets now. Get below those MAs and the bearish bias gets stronger.
On the topside, the $1296-97 remains a key area to get above and stay above if the buyers are to push more.