100 day MA looms
The better existing homes data helped to send the USDJPY toward the highs from yesterday and closer to the 100 day MA at 111.815. The highs yesterday came in between 111.72-78. The high today just peaked at 111.72. The highs from June peaked at 111.786. Going back to the end of the May, the high at that time reached 111.708.
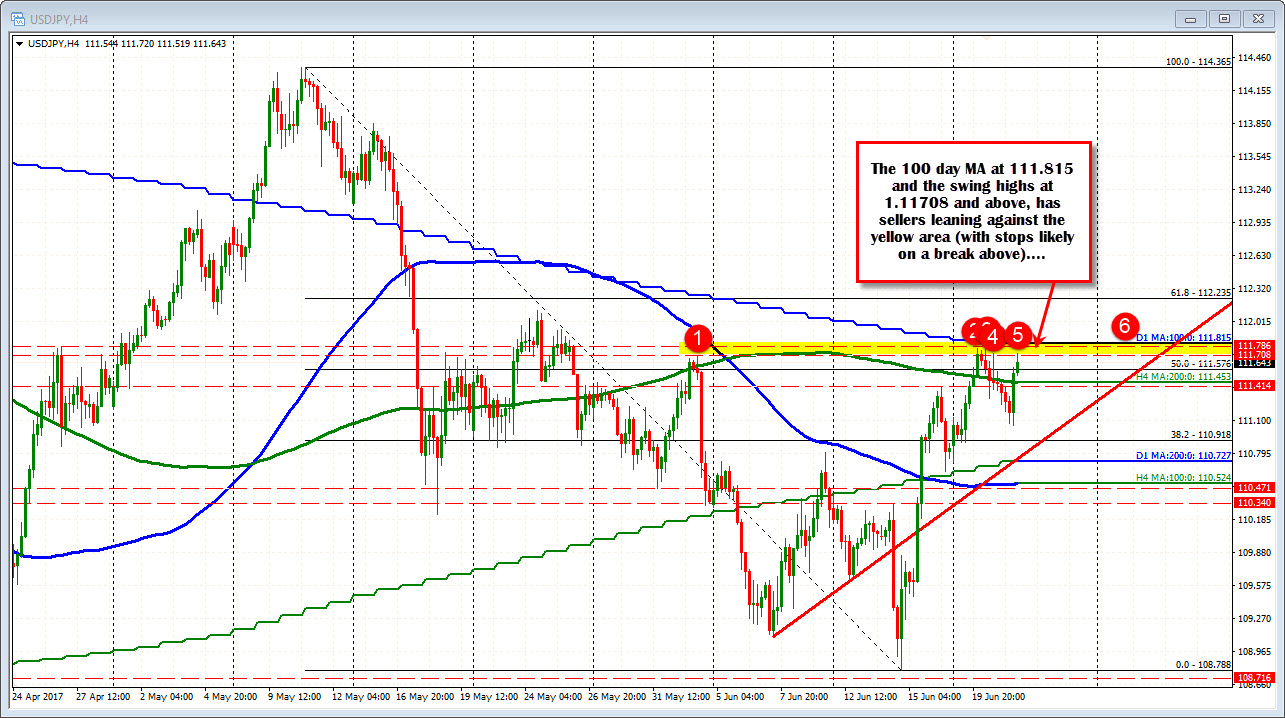
So there is a lot of topside resistance at the 111.71-815 level. I am not surprised to see sellers lining up against the area. Risk is defined and limited. There are a lot of reasons to lean. On a break above look for stops though.
We currently trade at 111.62.
US bond yields are up about 1 to 1.5 bps in trading today. US stocks are mixed with Nasdaq up 0.38%, the S&P unchanged and the Dow down -0.06%. The crude oil inventory data is up at 10:30 AM ET (est. -1200K).
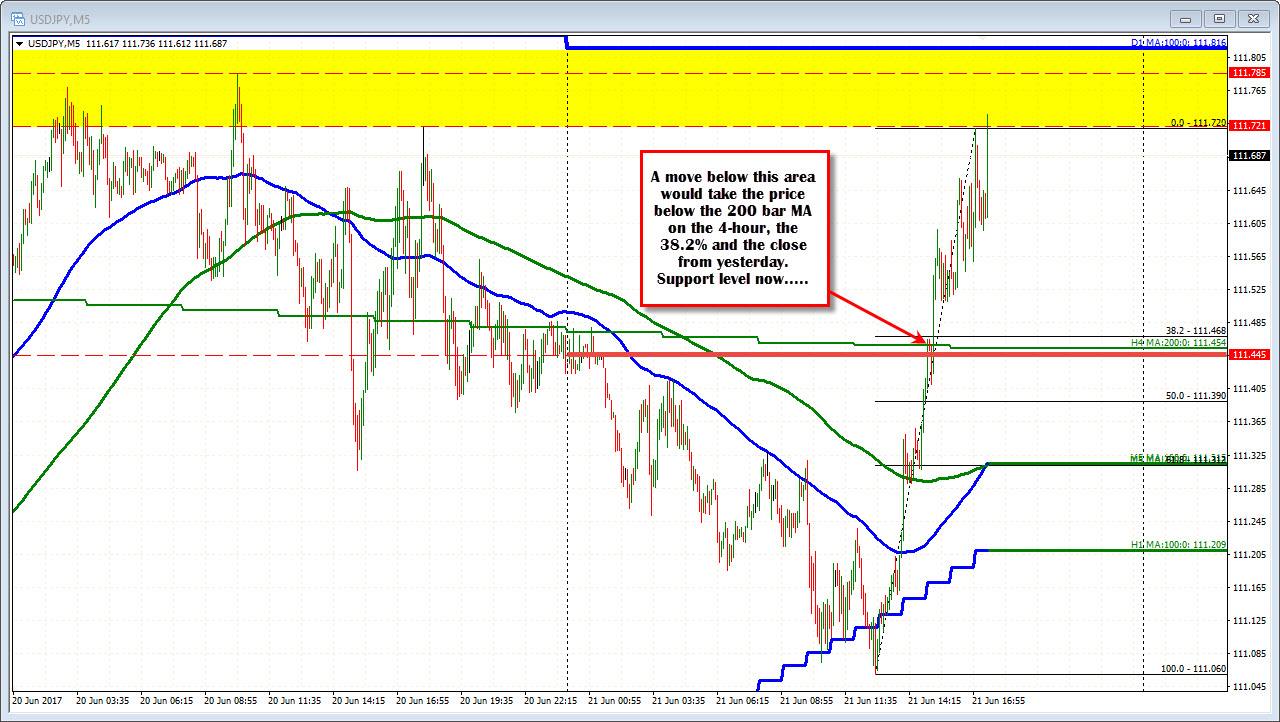
On the downside a move below the 200 bar MA on the 4-hour chart at 111.453 area would be more bearish. The close from yesterday came in at 111.44. The 38.2% of the day's range is 111.468 (see 5-minute chart below). A move below that area would take some of the steam out of the upside move.