
The price is trading between the 100 bar MAs
The USDCHF has a floor at the 0.9711 and a ceiling at 0.9768-0.9772 levels. The area is defined by the red box on the chart below.
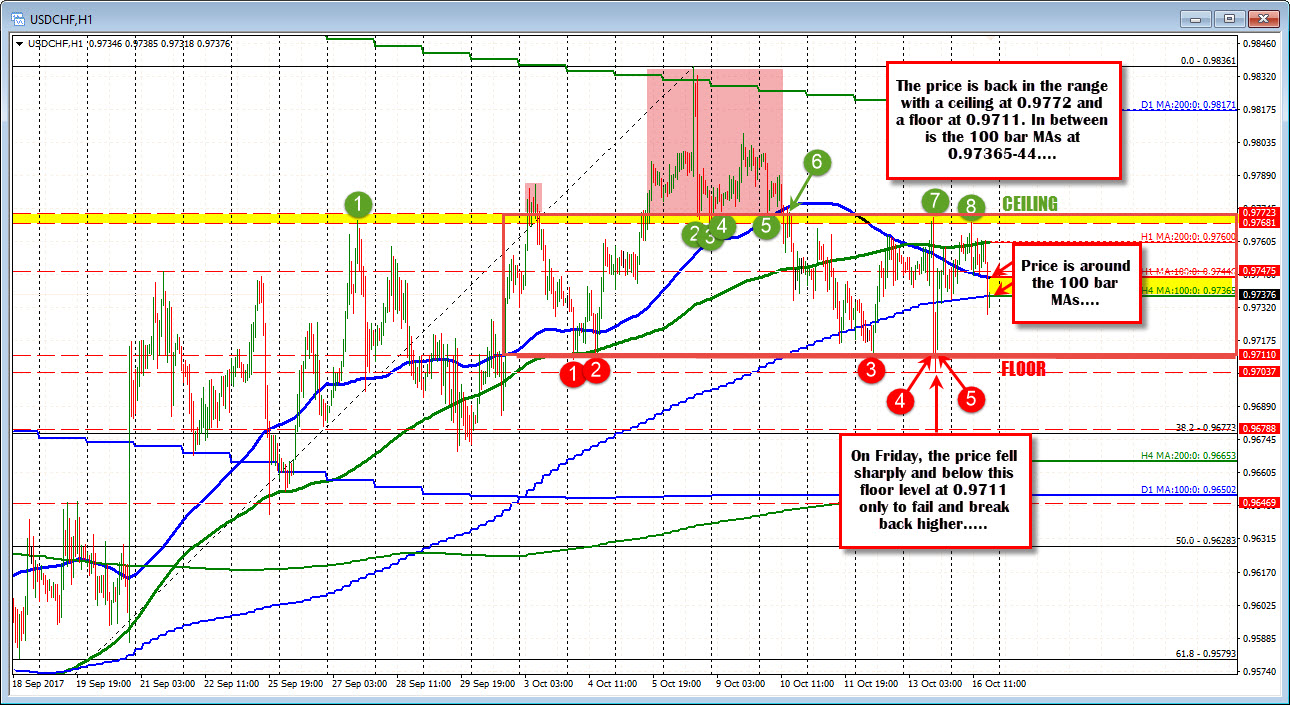
Yes, there was three day period when the price traded above that level going back to October 5th and on October 6th the price traded up to the 200 day MA (green step line). The lows after that spike came down to the 0.9768-72 and held until the break lower. The ceiling was reestablished and is stronger as a result of three successful tests (see green circles 6,7, and 8).
The floor was broken on Friday for one bar, then reestablished on the very next bar (red circle 5). That is solid too.
Between - in the middle - sit the 100 hour MA at 0.9744 and the 100 bar MA on the 4-hour chart at 0.9736. The price moved below both but are not trading between the levels.
Trading the pair about trading the floor and ceiling and using the MAs in the middle as clues as to the markets love. Move below the MAs and sellers are keeping control. Move above the MAs and the buyers have an edge. At some point, the floor or ceiling will be busted, and that should lead to a move toward the other levels in the direction of the break.
To the upside, the 100 day MA at 0.9817 will be eyed.
To the downside, the 38.2% at 0.9677, the 200 bar MA on the 4-hour chart at 0.9665 and the 100 day MA at 0.9650 are the downside targets.
So...it is hard to get too excited about the price action, but for traders the floor and ceiling are important and in between the 100 bar MAs should give a barometer for the bulls or bears. Look for momentum on breaks. If it does not come, get out.

