
First break above since September 2014.
The NZDUSD continues to outperform to the upside. Today, the pair's price moved above its 200 week MA at the 0.7428 level. The last time the pair traded above that MA line was back in September 2014. The MA was at 0.8134 at the time. The MA is 700 pips lower now.
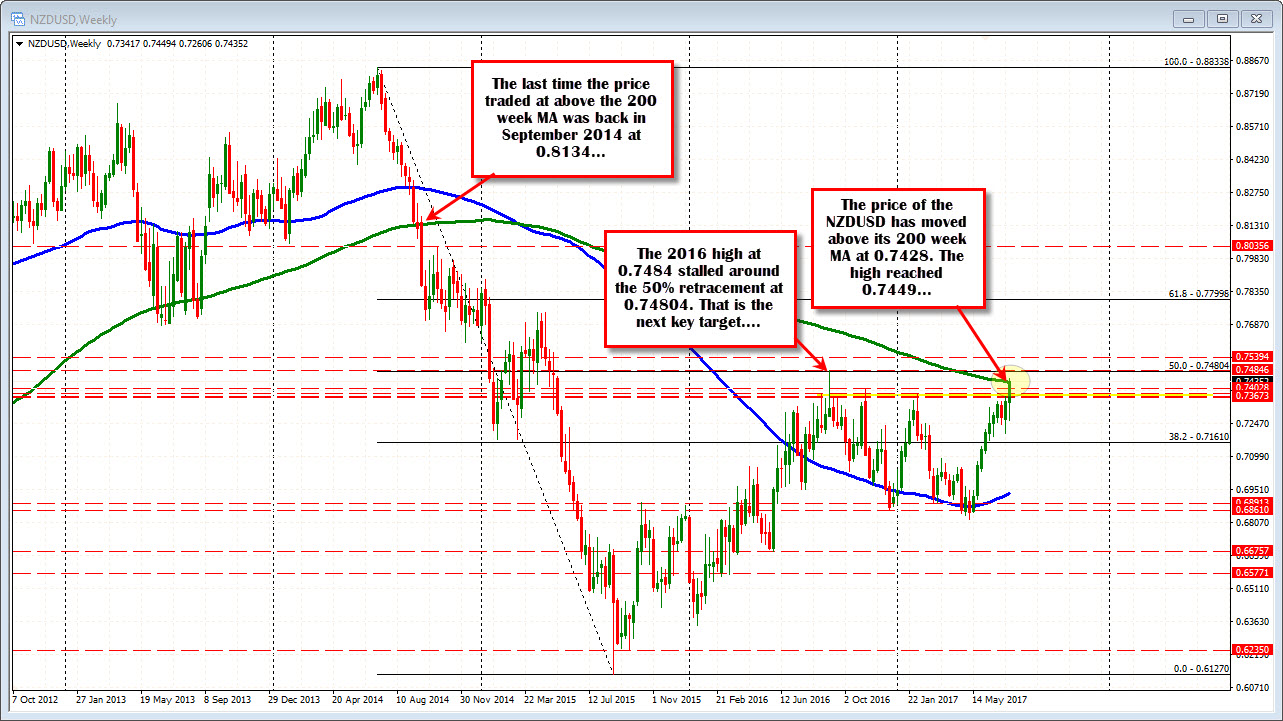
The move above keeps the bulls firmly in control The high price since the August 2015 low comes in at 0.74847. That is the next major target on the weekly chart (if the price can stay above the key MA going forward). The 50% of the move down from the 2014 high comes in at 0.74804. Needless to say, that high area is pretty important.
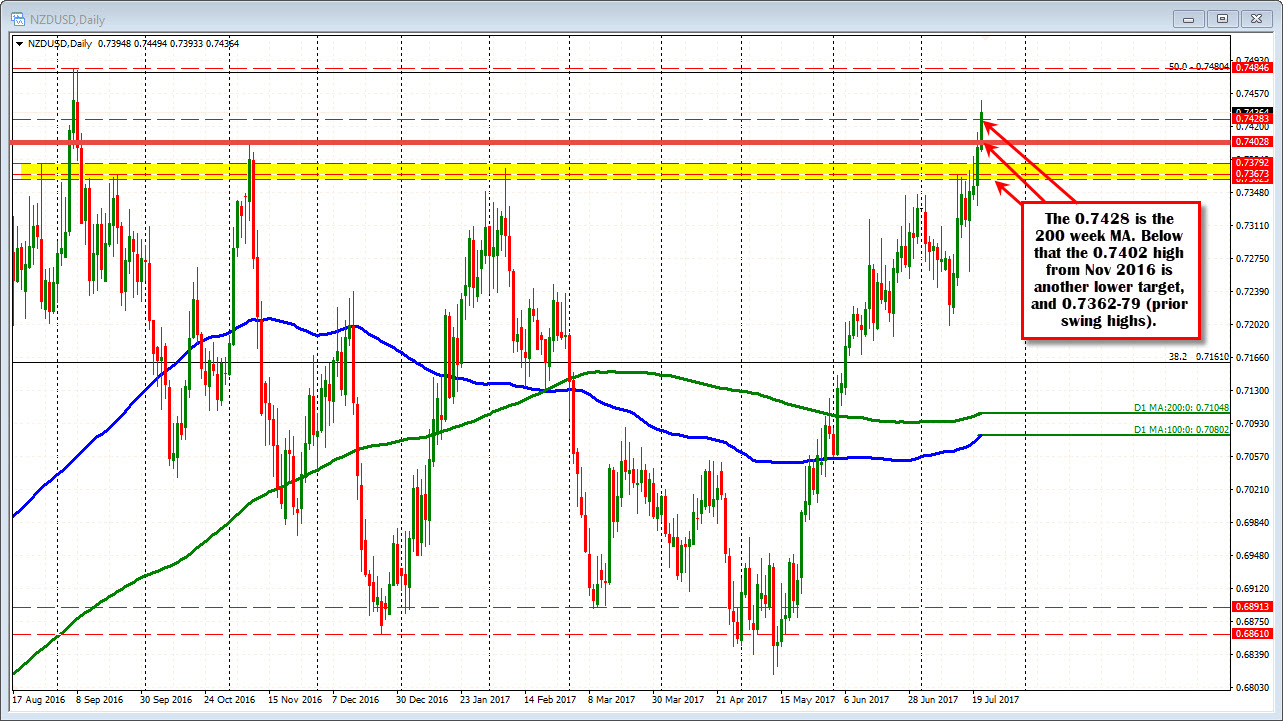
On the downside now, the highs at 07402, and then other lows going back to August 2016 in the 0.7362 to 0.7379 area (see yellow area in the chart below).
Drilling to the hourly chart below, the 0.7428 level (200 week MA line) was resistance on the first test. After a correction lower, the pair broke above and has now used the level to push higher.
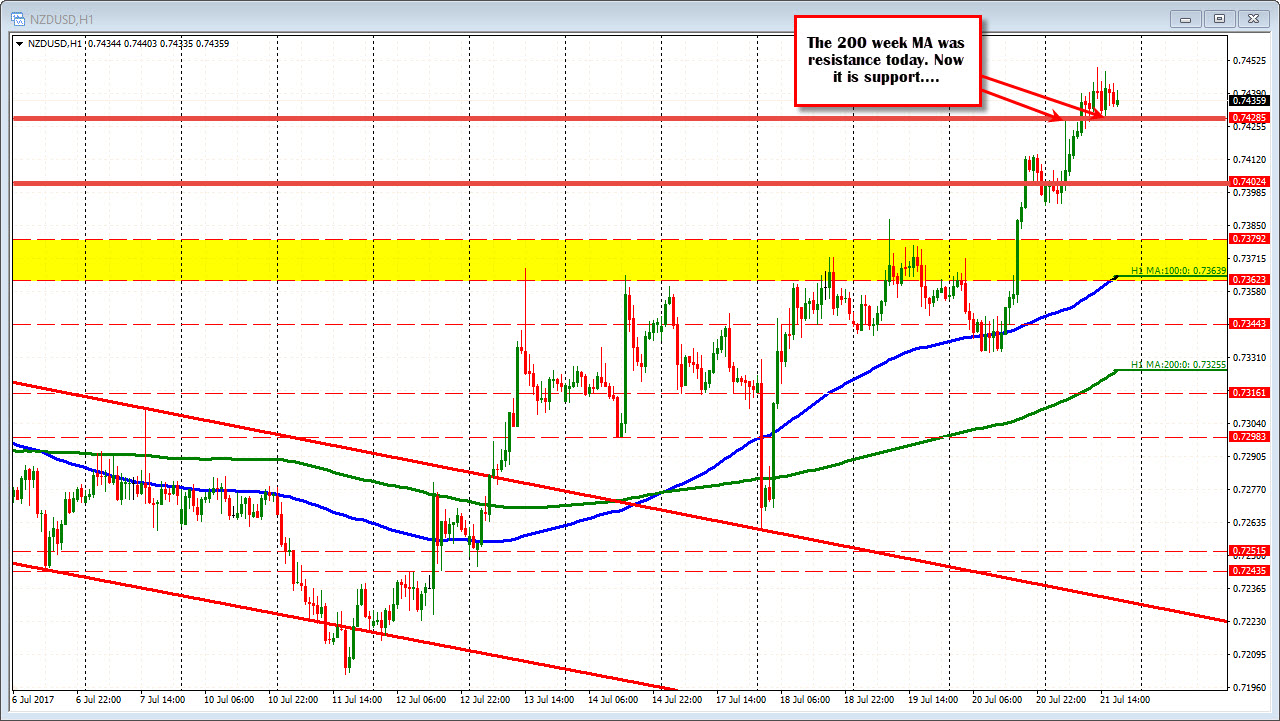
Typically, I expect the first test to fail, but we have to respect the break too. So keep an eye on that level going forward (today or early next week).

