
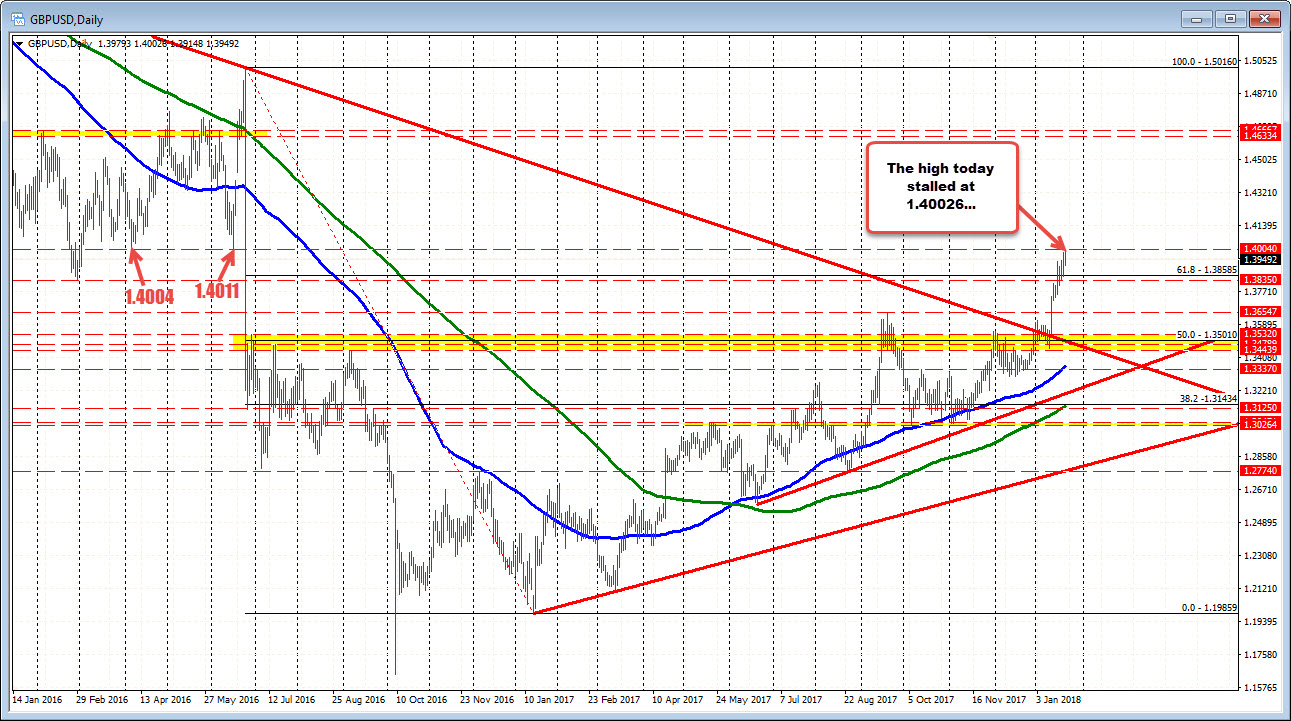
The 1.4004-11 (and natural 1.4000 level) stalled the rally.
Looking at the daily chart of the GBPUSD, the pair stalled just short of the next targets. In April and June of last year, the swing lows came in at 1.4004 and 1.4011 respectively. The high today (19 month high) extended to 1.40026. Sellers leaned against the key resistance.
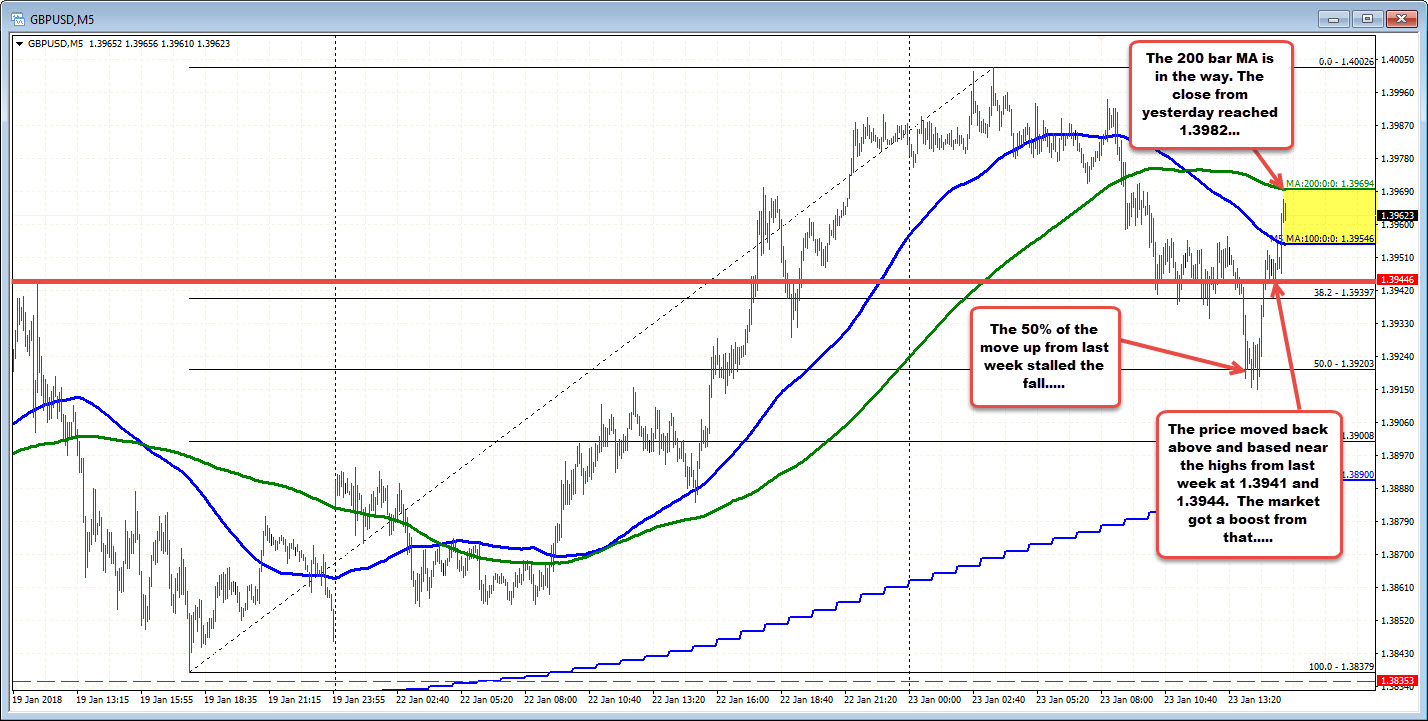
The price moved lower and bottomed at 1.39148. That was near the 50% of the move up from the Friday low at 1.3920.
We are seeing a rebound from that low now and trade up at 1.3965 area. In the process we just moved back above the 100 bar MA on the 5-minute chart at 1.39546 (blue line on chart below) and approach the 200 bar MA at 1.39694 (green line). Above that, the close from yesterday was at 1.3982.
The price is also now moving more away from the prior swing highs from last weeks trading at 1.3941 and 1.3944. That might be barometer for bulls and bears now as the market price swings around.
Oil price just moved higher and it seemed to kick the dollar back lower. Other than that, there is not much news to move the market (but intraday technicals did improve a bit).
Yields in the US are also lower. The 10 year and 2 year notes are trading at yield lows for the day. The 2 year is at 2.048%, down -1.2 bp. The 10 year is at 2.6149%, down -3.5 bp. That too is contributing to a lower dollar perhaps.

