
Can't stay below the 100 day MA
The GBPUSD fell below the 100 day MA on the back of the worse than expected UK CPI and the better than expected US retail sales. The MA comes in at 1.2855. The low reached 1.28454 (a couple times). Looking at the daily chart below, the 61.8% of the move up from the JUne low was also in the area at 1.28478 (see daily chart below).
Each of the next 4 hours after the initial break below the MA traded above and below the MA line. Unfortunately for the shorts, the selling momentum stalled on each look.

Now the sellers are giving up (or so it seems). We are getting more of an upside move (trade at 1.2874 currently).
Drilling to the 5-minute chart, the pair is just moving above its 100 bar MA (blue line) at 1.28678. The 38.2% of the move down today will look toward the 1.2893. The 50% is at 1.29077 (and moving lower).
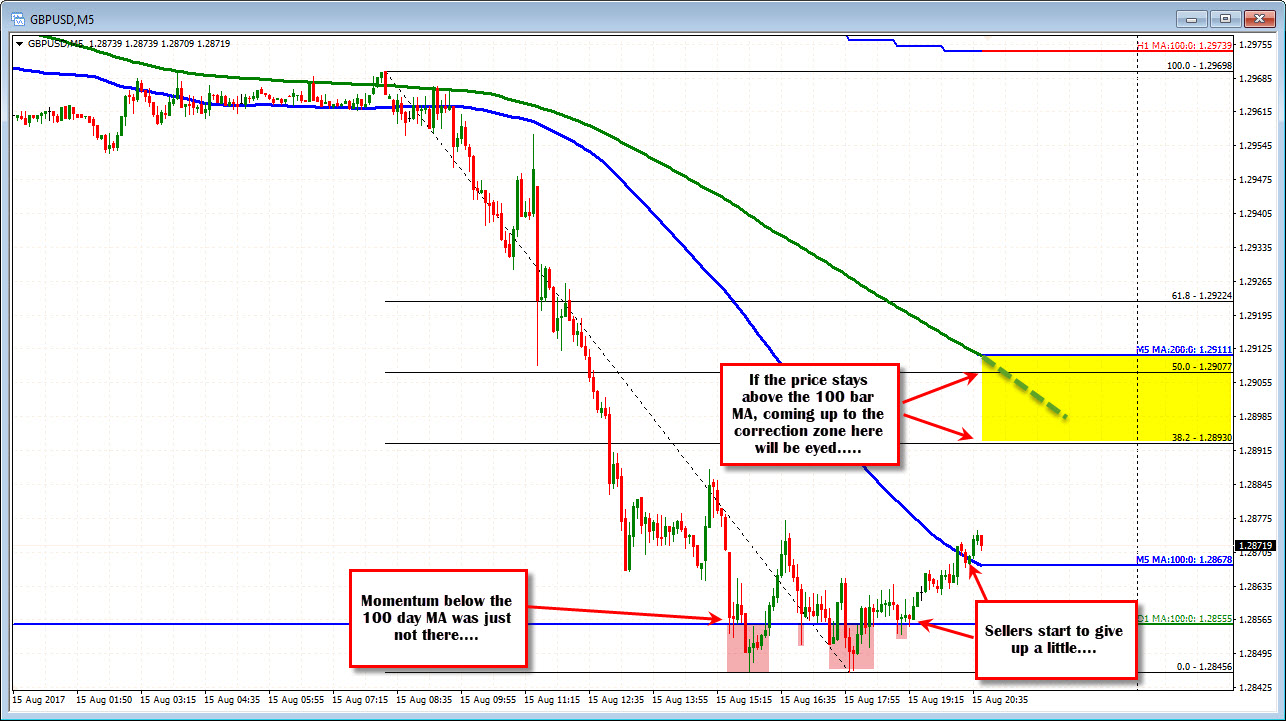
Summary: The test and failure below the 100 day MA, has traders covering a bit. Is it the end of the world for the shorts? We really don't know just yet but we have to respect that 100 day MA. The price could not muster much momentum below. So watch things like the 100 bar MA on the 5 minute chart for clues. Stay above is more bullish. Move below could be more bearish again. Then watch the 1.2893-1.2907 area. A move above that area and more sellers looking for more downside, will likely throw in the towel.

