Tests/breaks (it's trying) MA resistance
The GBPUSD has followed the path of the dollar post the US data. That trend is to the downside.
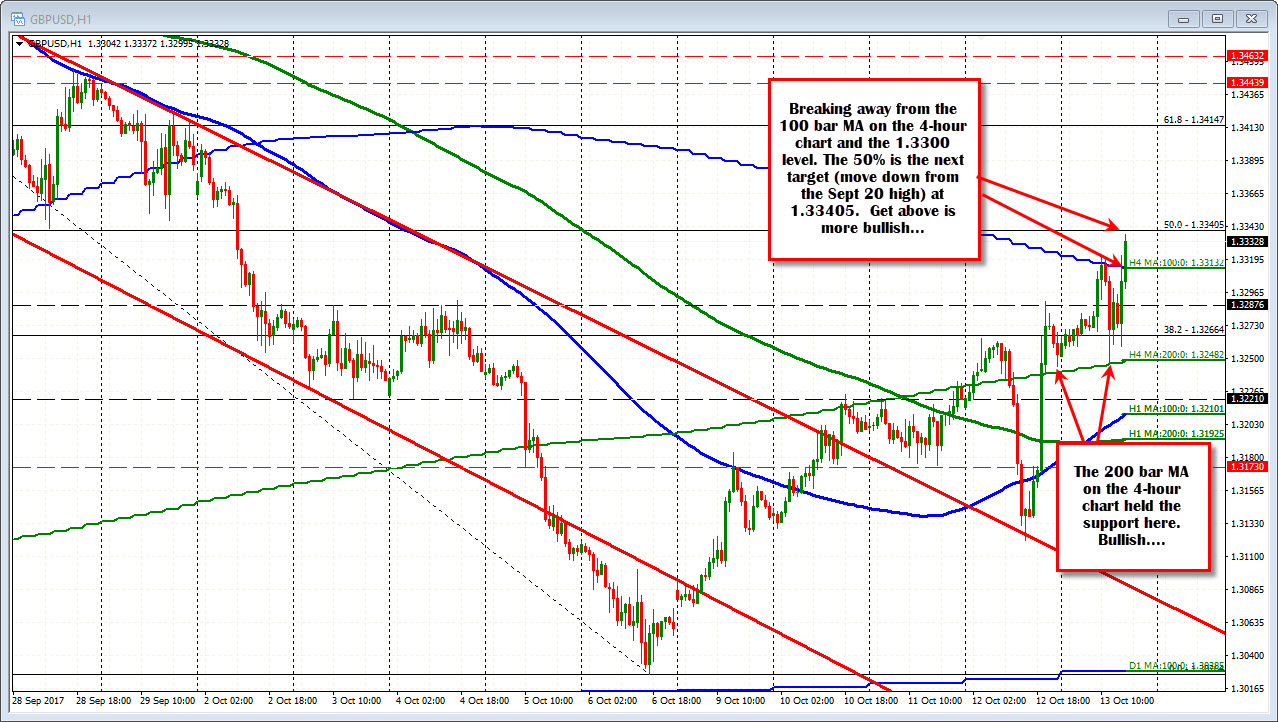
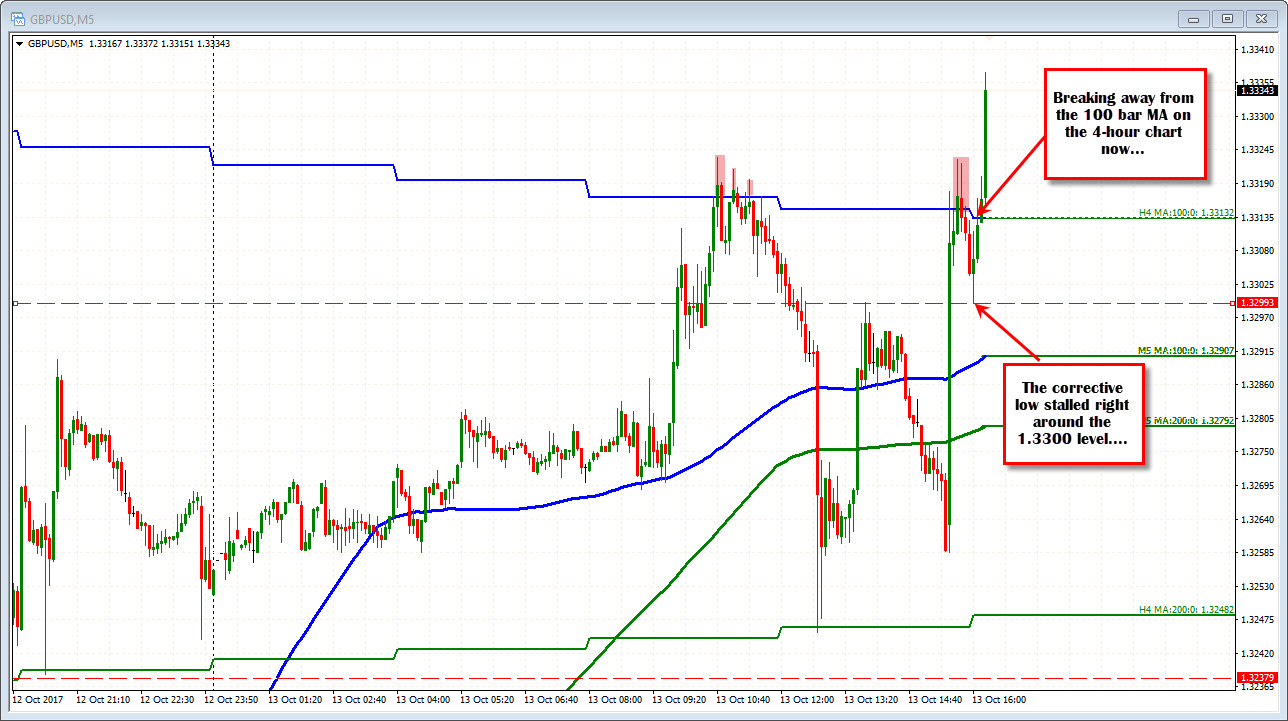
The price is back up testing the earlier highs for the day and in the process the 100 bar MA on the 4-hour chart (blue step line in the chart above). That MA comes in at 1.3313 currently.
The run up off the data also saw the price spike above the 1.3300 level. The correction off the first spike, saw the low come in at 1.3299. There may be something about that natural support level.
As I type the GBPUSD is making new session highs and moving further away from the 100 bar MA on the 4-hour chart and the 1.3300 level. Trades to 1.33372 high. Traders will now eye the 1.3313 MA line as close risk and 1.3300 as a line in the sand for bullish above and bearish below.