The ups and downs of the market
Yesterday, the EURUSD raced higher and tested its 100 hour moving average (Blue line in the chart below), The market stalled against that level and wandered more into the close.
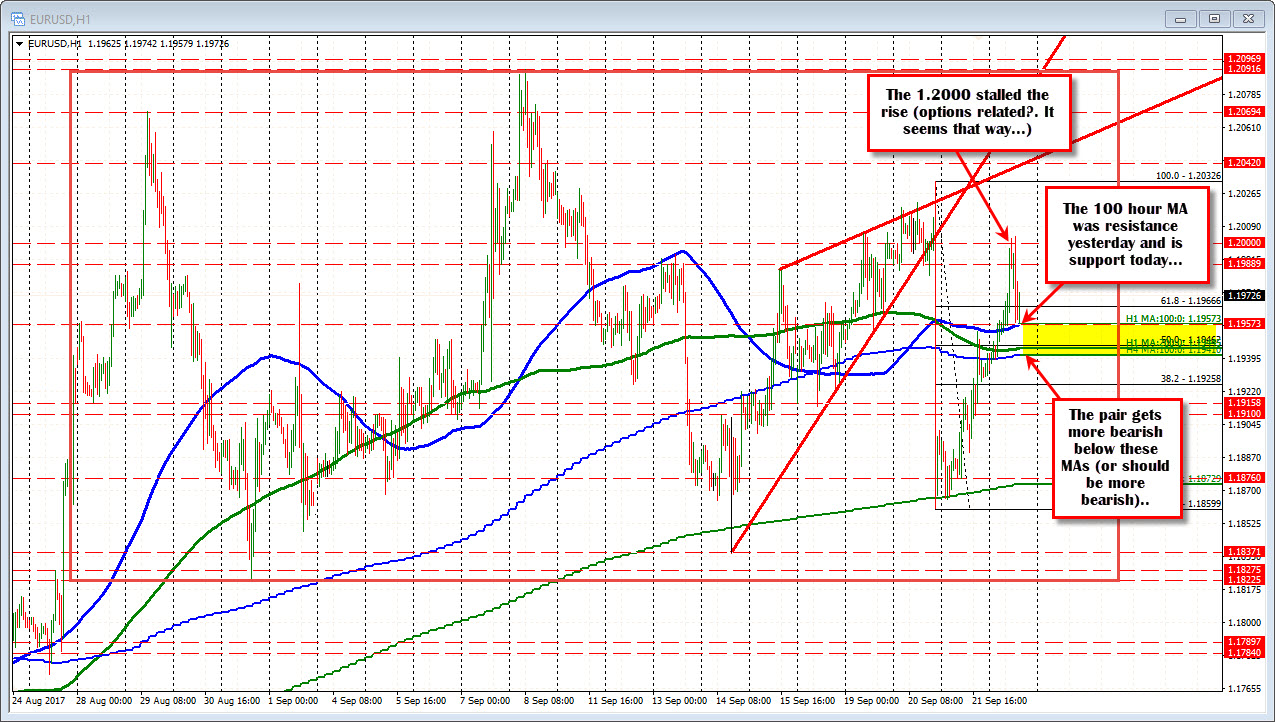
Today, the pair moved above that MA line (currently at 1.29573). The bias turned more bullish and the price moved higher in the early European session to a high of 1.2004 - just above the natural 1.2000 resistance area. According to Mike, there is a large option expire at 1.2000.
The price ceiling was found. The price moved lower. The price is stalling at the 100 hour MA again at 1.19573 (the low just reached 1.19579 - a London session low). The current price is trading at 1.1972 currently.
Well, we know the 100 hour MA is garnering the attention of traders as a risk defining support level. On the topside the 1.2000 level - at least until 10 AM ET option cut off - is in play as well.
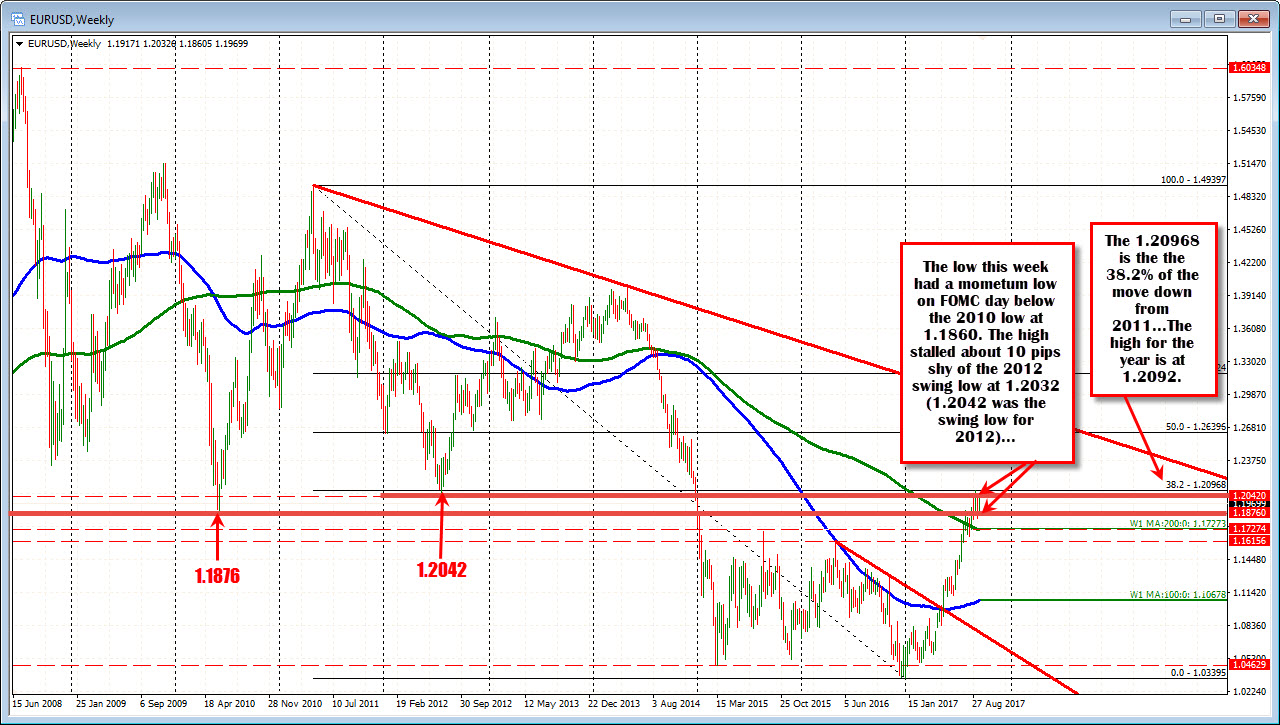
On a move above the 1.2000 level, the high on FOMC day at 1.20326 will be eyed. The 1.2042 was the low swing price from 2012. Above all that and the 38.2% of the move down from the 2011 high comes in at 1.20968. The high price for the year reached 1.2092. Key level/area for the EURUSD on increased upside momentum.
For this week, the low fell below the 1.1876 level on a momentum run on the FOMC day. The low extended to 1.1860 before bouncing. The 1.1876 level was the 2010 swing low (see weekly chart below)
On the topside this week, the pair stalled ahead of the 1.2042 level (high reached 1.20326). The 1.2042 level is the swing low from 2012 (see chart below).
So the market has the swing levels from 2010 and 2012 more or less covered in trading this week as it decides the next bigger move (see weekly chart below). Keep them both in mind as they can swing the bias around on breaks.