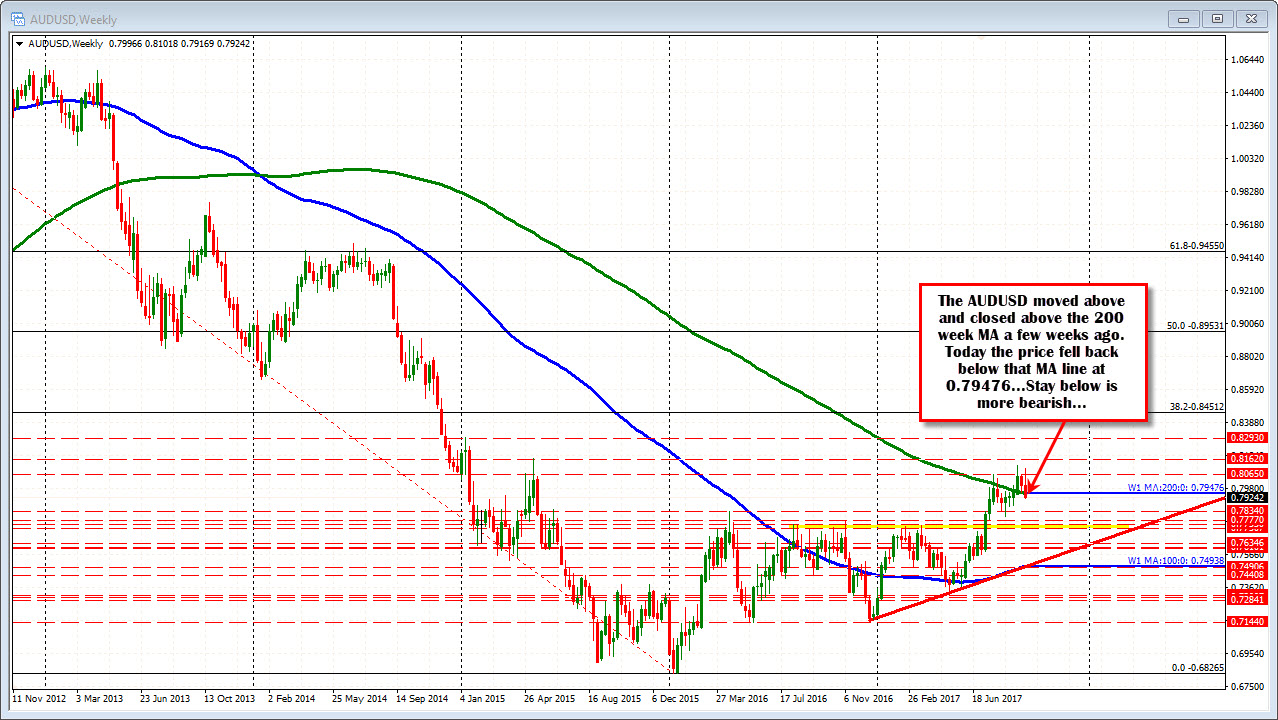
The 0.79476 level is home to the 200 week MA AND the 200 bar MA on the 4-hour chart.
The AUDUSD cracked and closed above the 200 week MA for the 1st time since May 2013 two weeks ago. Last week, the price closed lower but held the 200 week MA.
Today, the price has broken back below that MA line at 0.79476 (see green line in the chart below). We currently trade at 0.79237. Stay below is more bearish.
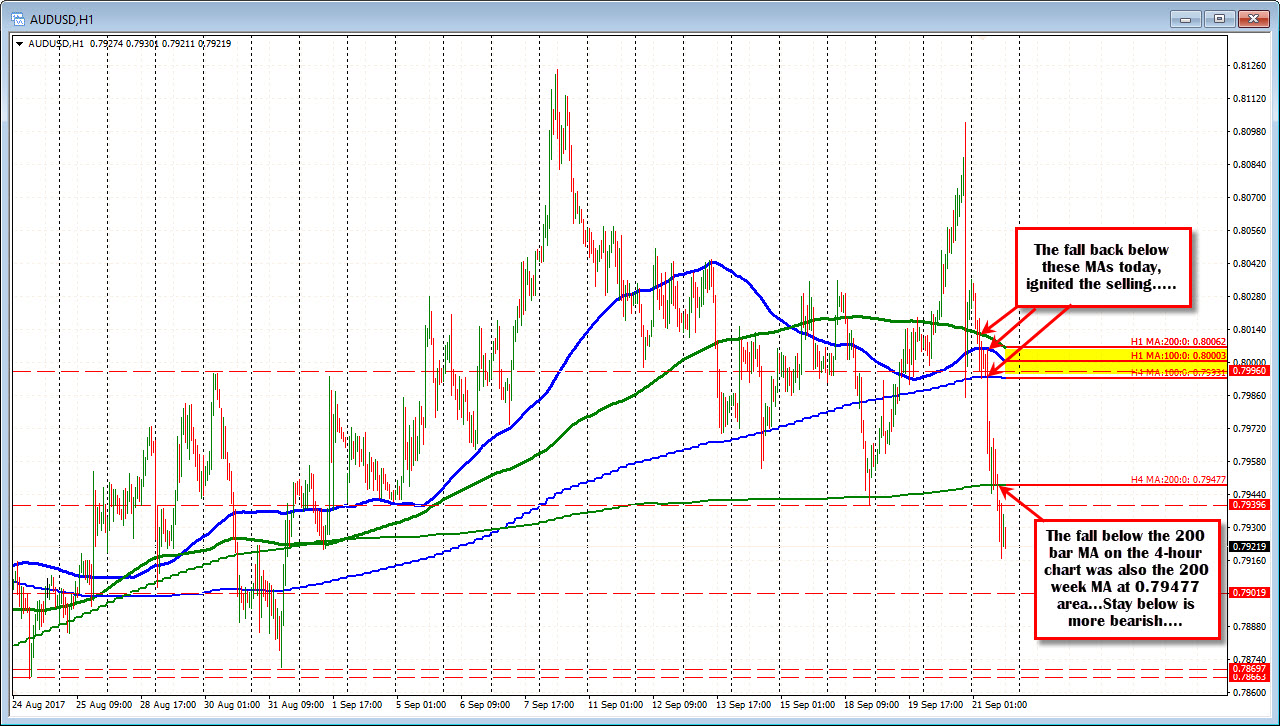
Drilling to the hourly chart below, the pairs fall today, started to gain momentum on the move back below the 200 hour MA (green line at 0.8006), the 100 hour MA (blue line at 0.80003) and the 100 bar MA on the 4-hour chart (blue step line at 0.79931). That final MA line at 0.7993 was the straw that broke the camels back. The price ran lower.
The tumble initially stalled at the 0.79477 level. That is the 200 bar MA on the 4-hour chart. Remember, it is also where the 200 week MA line cuts across. Key level.
Support held for a few hours at that area, but then broke lower (see price action below the lower green line in the chart below).
Going forward, having the 200 week MA and the 200 bar MA on the 4-hour chart at the same level, increases that levels importance as a key risk level for shorts. Stay below and look for further downside. Move above and some of the shorts today, will likely be tempted to cover.