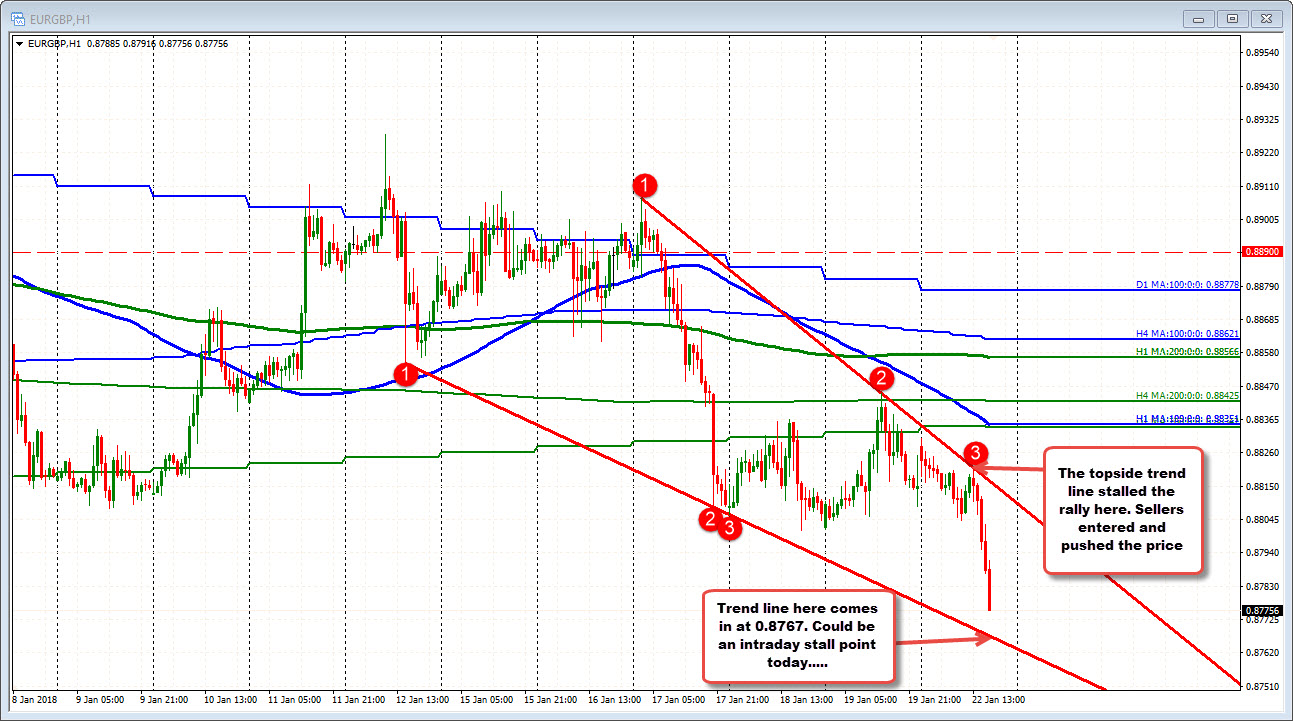
The moving away from the 200 day MA. Intraday trend line support at 0.8767 approached...
As the GBPUSD strengthens, the EURGBP is falling.
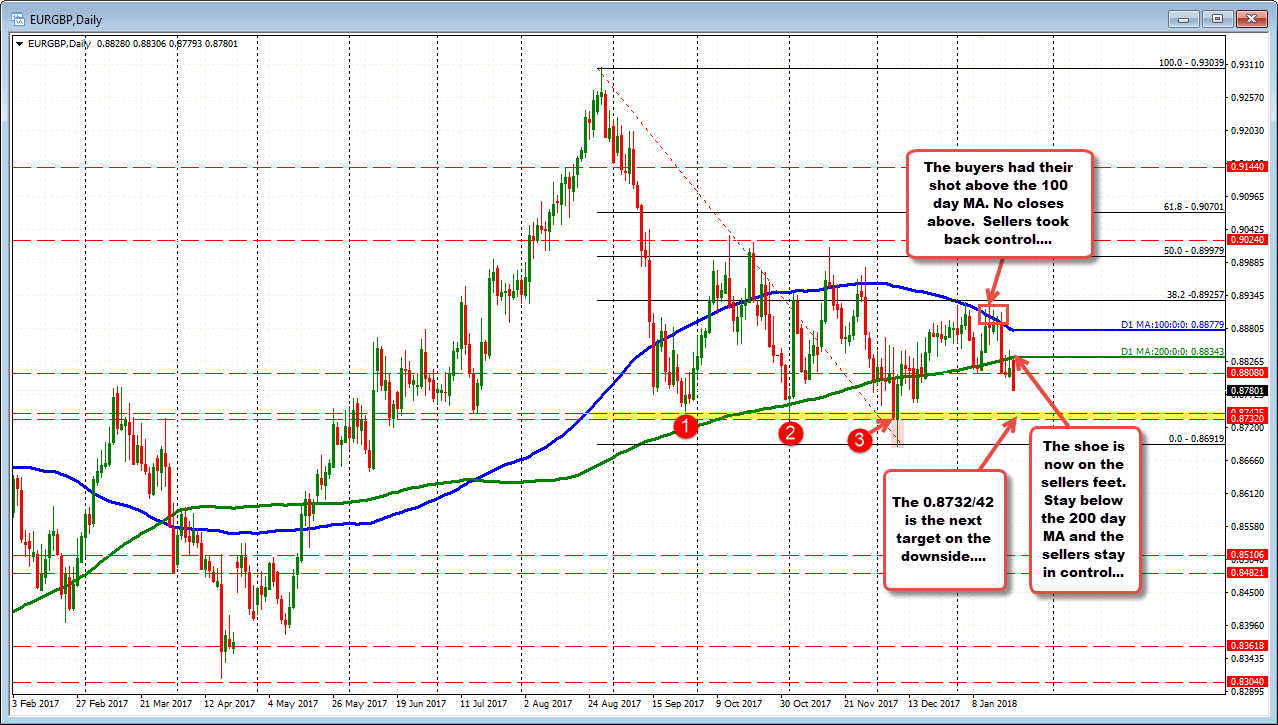
Technically, the price is trading for the 4th day below the 200 day MA at 0.88343. Today is a bigger break lower. We trade at the lowest level since December 15, 2017.
Looking at the daily chart, the buyers had their shot to take the pair higher. From January 11 to January 17, the price traded above the 100 day MA each of the 5 trading days in that period. However, there were no closes above the key MA. The buyers gave up and forced the price lower last week.
The shoe is on the other foot now as the sellers have firm control and have traded the pair below the 200 day moving average for the 4th consecutive day. That moving average at 0.88343 is risk for shorts looking for a further run lower in this pair.
The makes key target comes in at 0.8732/42 area. That is the home of 3 swing lows going back to September. There was a break below on December 8, but that break failed. I would expect buyers to stall the fall on the first test at least, with stops on a break.
Drilling to the hourly chart below, the price high today stalled at the topside trend line. That helped the sellers. On the downside, the lower trend line comes in at 0.8767. Watch that level on continued selling today. It too may stall the fall - at least today.