
Bitcoin/Bitstamp charts are different but similar.
As the stock market surges to new highs, the Christmas/Holiday parties are not talking Apple, or Microsoft or Intel, but bitcoin.
My wife works for Intel. They had their holiday party on Friday. Their stock is up about 28% vs a year ago.
When I introduced myself to mostly strangers, and the discussion led to "I work in the financial sector as a currency analysis/trader", the conversation went right to bitcoin. It IS the cocktail party discussion.
When talking with the people on Friday, one thing I talked about is that the market price is really not transparent. Case in point, the CME futures contract will cash settle to 5 exchange prices (which is different to the CBOE contract which settles to one). If the different exchanges were transparent, the price on each exchange for Bitcoin would all be the same (give or take a small difference).
So there is not price transparency in the bitcoin market. Bitcoin has different values on one exchange vs another. It got me thinking and looking today...
So what are the implications of not having a transparent price?
For one, bitcoin could not be a unit of exchange for goods and services.
How would a vendor know what to price goods and services, if the price on one exchange is different than another? Putting it another way, which exchange do they use to price $200 of goods?
It can get confusing - especially in a world where USD, or EUR or JPY or GBP are not going anywhere, any time soon.
Does that matter to "traders" who are not using bitcoin to buy something at some "store"?
For most "traders" out in Bitcoin land, they don't care. If they buy on Coinbase or Bitstamp and the price goes higher, what is the big deal? Those people are just "trading" bitcoin on their exchange. Just go higher and the "traders" are happy.
Are these "traders" really trading?
To me a trader is not just concerned about reward, but are at least, equally concerned about risk.
For me, risk is even more important. It is 80-20 vs reward. I like to say, "if a trade is not risked out, you are rewarded. Focus on risk, and let the reward take care of itself".
So "traders" (in quotations) of bitcoin who do not define risk, are not really traders because they are just concerned about reward, and have no concern (or very little concern) about risk.
So how do I characterize "traders" who are not concerned about risk?
The "traders" who are not concerned about risk, and only about reward are simply speculators in a speculative market (some call it a bubble). That bubble could continue to go up and up and up. It could burst too.
When it burst, speculators could lose a good percentage of their money.
Traders will not.
So if you want to be a trader and not a speculator, the next question is what is your risk? How do you define risk?
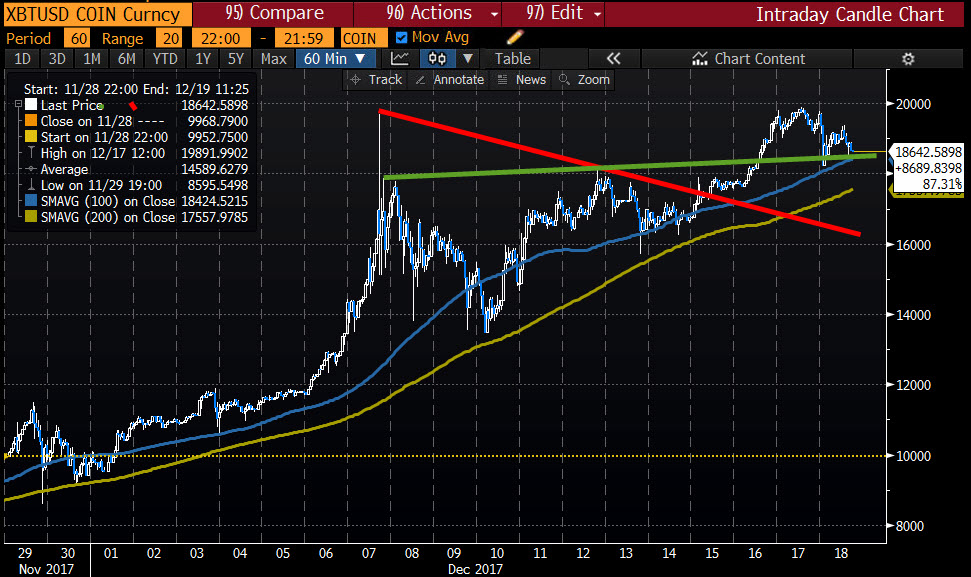
If I put a chart up of Coinbase's bitcoin, it looks likes this:

Traders can define risk (and a bullish and bearish bias) by using technical tools like trend lines and moving averages.
The trend lines are the solid lines. There is a red one that comes down from the December 7th peak on this hourly chart, and flatter upward sloping green trend line.
Looking at the chart, the price moved above the red trend line on December 15th and above the green trend line on December 16th. Each turned the bias more bullish on the break above.
Today, the price has been testing the green trend line. There was a little dip below, but that break failed.
What about the MAs?
The blue line represents the 100 hour MA. The green line is the 200 hour MA.
The 100 hour MA has been breached going back in time. The falls below have solicited a downward reaction but the price has also bounced back above after a relative short time period. I like to think as the blue line as a trigger.
Looking at the green line in the chart above, it has done a really good job of holding support and attracting buyers. There have been tests of the green line but apart from a brief failed move below the line on November 29, the price has remained above that MA line. The green line is a confirmation MA line. If broken, it would confirm a more bearish market (as long as the price stays below).
Traders (no quotation), can use each of those tools (trend line, 100 and 200 hour MA) as a risk defining tool. Stay above, bullish. Move below, bearish - to different degrees. Traders can define and limit risk using those technical tools.
For today in the chart above, the green trend line and the 100 hour MA are roughly at the same level. As a result, a break below would be more bearish in the Coinbase chart above. That 100 hour MA comes in at 18424.52.
If the price goes below the 100 hour MA and trend line, traders would still want to see the 200 hour MA broken (green line). A break below that MA line, would confirm the bearish bias. It would represent a change in what traders have been doing (i.e. buying against the 200 hour MA).
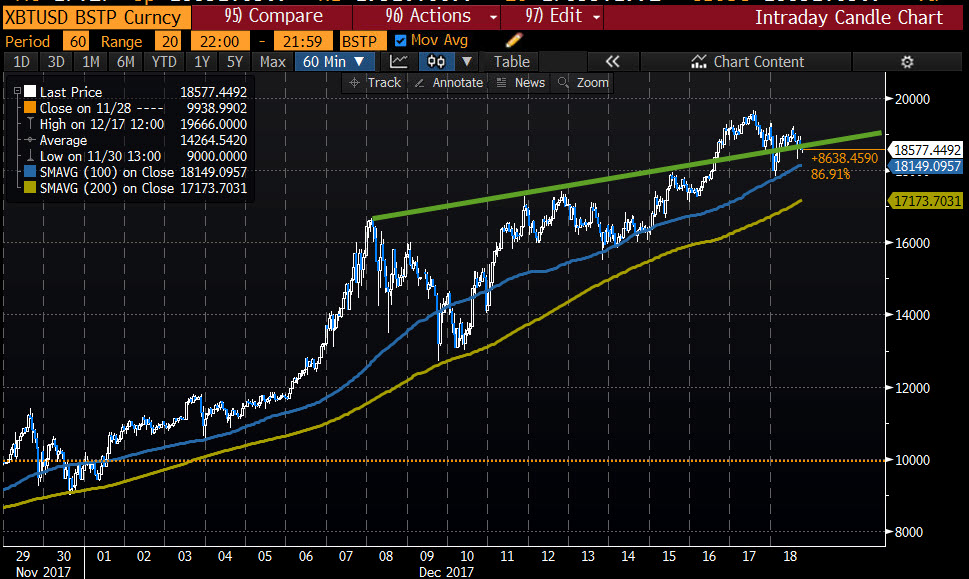
Now lets look at the same chart from Bitstamp - a different Bitcoin exchange (see chart below). This chart picture was taken at the same time of the Coinbase chart.
What is different?
- The current price is different. The Coinbase price is $18642 (chart above), while the Bitstamp price is $18577 (chart below). The price is not transparent
- The Coinbase chart (chart above) has a spike higher on December 7th. The Bitstamp chart below does not have a spike. Why it spiked on one vs the other is not sure, but you can guess that a large order on Coinbase, was the likely reason,
- If you look at the price box in each chart, the price high on each was on December 17 at 12:00. For Coinbase (upper chart), the high was at $19891.99. For Bitstamp (chart below), the high was $19666.
- The current 100 hour MA on Coinbase (chart above) is 18424.52 while the 100 hour MA on Bitstamp is lower at 18149.09 (chart below). The 200 hour MAs are different too with Coinbase at $17557 and Bitstamp at $17173.
- The green upward sloping trend line is higher relative to the blue MA line in the charts. For the Coinbase chart above, the green trend line is right near the MA line. For the Bitstamp chart below, the trend line is further above the 100 hour MA
What is the same or similar?
- The market lows on each chart held the 200 hour MA on corrections and the distance looks similar,
- Both exchanges had price dips below the 100 hour MA (blue line) at the same times and tended to have a momentum reaction on the breaks.
What does that all tell me?
It tells me that traders - without quotations - despite the differences in price transparency, are still trading some of the technicals from each respective chart. The bitcoin traders in the chart above tend to sell on the break of the 100 hour MA (blue line) and buy vs the 200 hour MA (green line).
Think of the 100 hour MA as a trigger. The bias turns more bearish below, but it needs more. That "more" is the confirmation below the 200 hour MA. A break below it, should be even more bearish.
Now will a break of the 100 hour MA (assuming it happens at some point) happen at precisely the same time on each exchange?
Right now, without price transparency, we really don't know.
The price on Coinbase could break the 100 hour MA BEFORE the price on Bitstamp breaks below it's 100 hour MA (or visa versa).
I think we can make the visual judgement - looking at each chart, that they are close (but at different prices).
For me that says technical levels are less exact.
It is more a "horseshoes and hand grenades" trading, but the trigger and confirmation can still be the technicals on each respective chart.
If I were trading on Coinbase, a move below its 100 hour MA would be more bearish. A move below it's 200 hour MA would be a confirmation of the bearishness even though each breaks would be at a higher dollar amount vs Bitstamp.
The same would be true for Bitstamp. A break below the 100 is a bearish trigger, while a move below the 200 hour MA would be a confirmation trigger.
SUMMARY:
To properly trade, you need to focus on risk too. Risk can be defined by looking at technicals. However, in bitcoin, different exchanges have different prices for the same bitcoin. That could be a problem.
The good news is that taking a look at two exchanges (Coinbase and Bitstamp), although the prices of Bitcoin are different, the traders (who are concerned about risk), tend to react to each exchanges technical levels. That is good news for the viability of a market as traders need a reference for risk.
"Traders" who are not concerned about risk and just want to speculate might make money in spite of their lack of risk concern. However, when the bubble bursts (and it can happen anytime), they stand to lose a lot of their investment capital without a risk reference.
So no matter the exchange, focus on your own technicals from your price stream. Although prices on exchanges are different, the tools are around the same trigger levels (relatively). So use them to your advantage.
For the future of bitcoin, to grow the market, there should be a movement toward price transparency. Traders want to know, their bitcoin over here is worth the same over there. That would be a good thing for the bitcoin trading market.

