
NY afternoon stuff. Where do we stand technically
Overall, a lot of the currency pairs remain in range-y ranges. That requires traders to think bullish and bearish. IF a key target is reached (or there is a failure at an extreme), you can go the other way. If a resistance or support level is broken look for momentum.
Below is the technical look for some of the major pairs.
EURUSD:
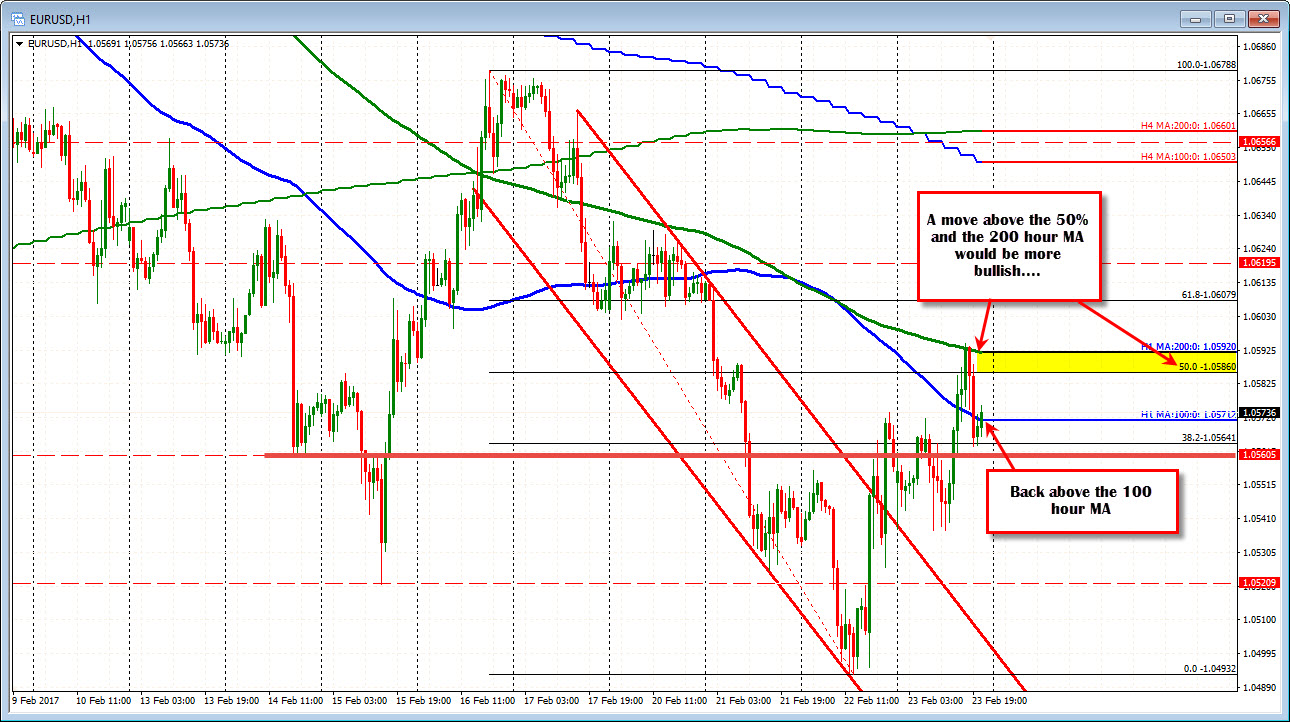
The EURUSD was mired in a 39 pip trading range when NY traders entered for the day. We extended that to 58 pips, which is better, but still not so great. The high reached the 200 hour MA at the 1.0593 level (the high reached 1.05948). Now that the MA was tested and held, it becomes a bigger hurdles for buyers now.
The correction off lower has stalled near the 50% of the days trading range (at 1.0566) and the 200 bar MA on the 5-minute chart at 1.0564 currently That is close support. We do not like going below the 50% and 200 bar MA on any chart. We are currently trading back above the 100 hour MA at 1.0571.
USDJPY
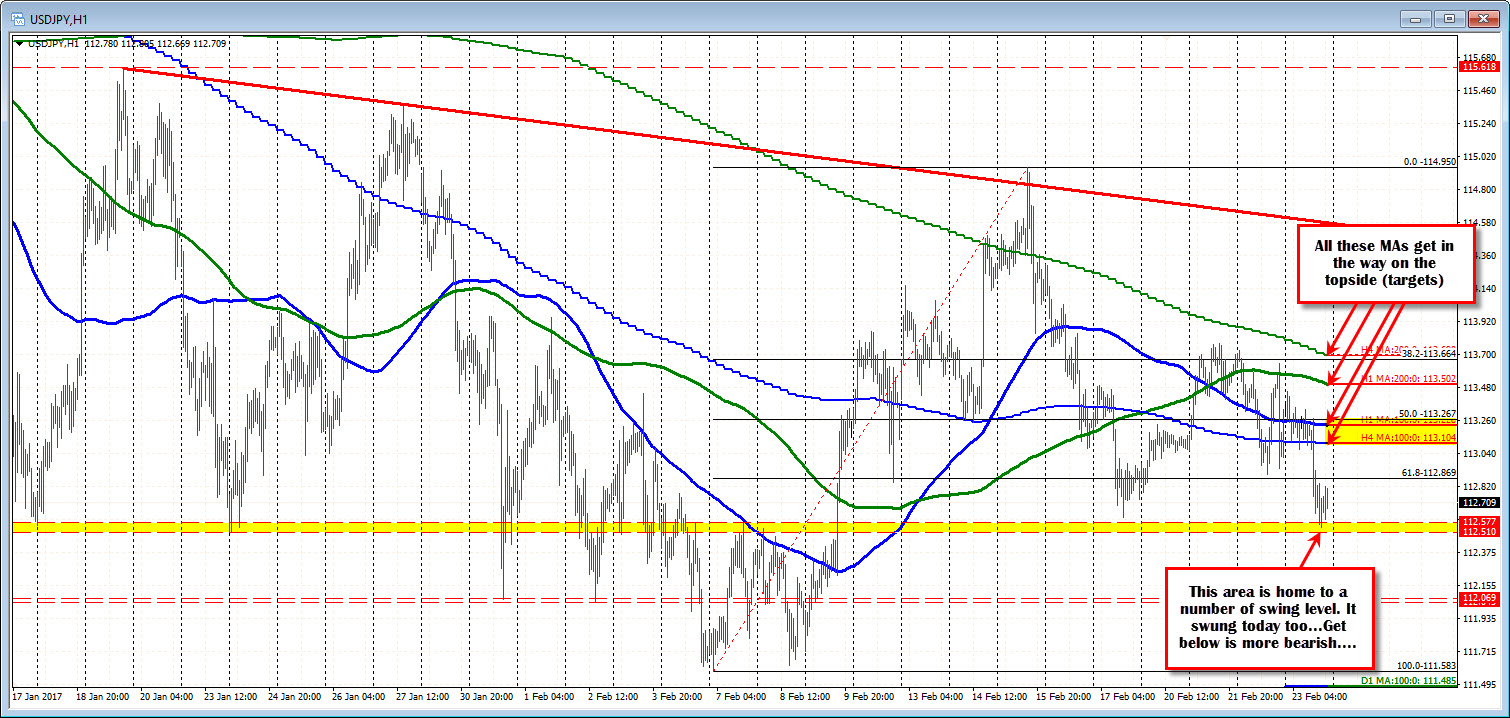
The USDJPY fell to support today. That support comes in at the 112.51-577 area. That area is home to swing lows/highs going back to mid January (see yellow area in the chart above). Today, the low swung against the level. The correction off the low moved to 112.82 low was at 112.54). We are not far from the low, but that level remains a key support level going forward.
On the topside, a bunch of MAs get in the way. The first is the 100 bar MA on the 4 hour chart at 113.10 and the 100 hour MA at 113.23. The pairs move to the downside got cookin' when the 100 bar MA on the 4-hour chart was broken with more momentum.
Buyers at the support are hoping for those MAs to be broken and the up and down price action to continue. Sellers looking for more dollar weakness, definitely want to see the 112.51 level busted.
GBPUSD
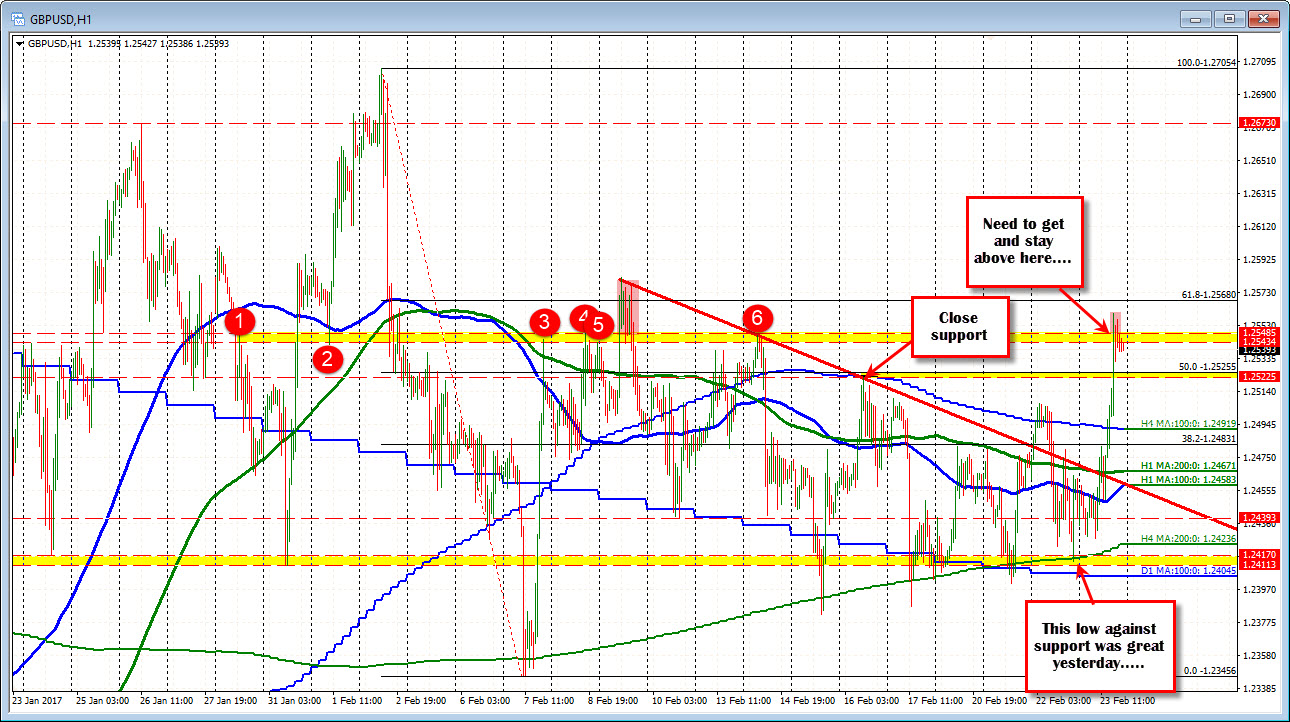
It was a big day up for the GBPUSD. The pair found it's base against the 100 hour MA, moved above the 100 bar MA on the 4-hour chart for good in the early NY session at 1.24919). Yesterday, that MA was also broken but failed. ON Feb 16th, that MA was tested and held. Today that MA was broken and kept the momentum going to the upside.
The rally triggered stops above the 1.2522 high from Feb 16th and rallied to a high of 1.2560. That eclipsed the 1.2543-48 area that is home to a number of swing highs/lows on the hourly chart (see yellow area in the chart above). The 50% of the move down from the Feb 2 high comes in at 1.2525. That is close support now. If this pair's move higher today is for real - is believable - the area from 1.2520-25 should hold support.
USDCHF
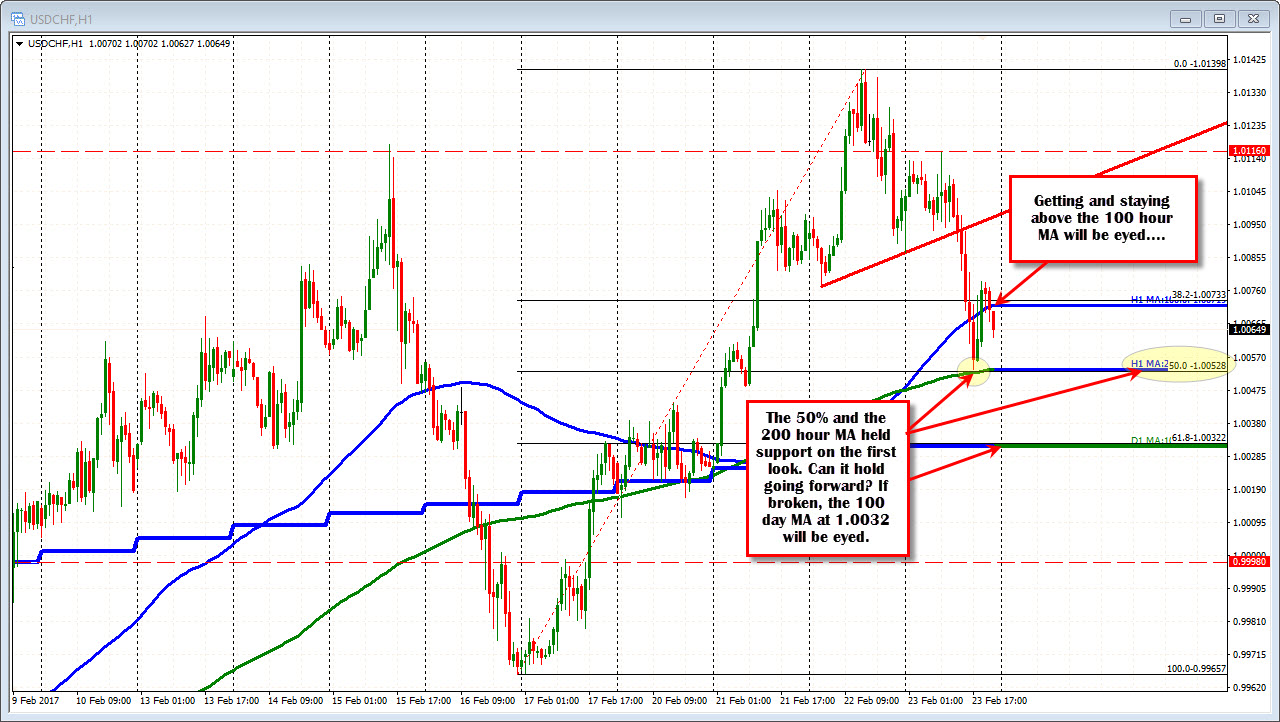
The 50% and the 200 hour MA held support today at the 1.00528. That magical level is a key dividing line for retracements and MAs (at least in my book). For and oldie but goodie video on the combo, watch the below email.
For this pair, the 1.00528 level will be eyed as a line in the sand in the new trading day. Stay above is more bullish. Move below is more bearish. On a break lower the 100 day MA at 1.0032 will be the next key target. With the price now below the 100 hour MA (blue line at 1.0072) the pair needs to get - and stay - above that MA line.

