
Battle of the Daily MAs vs. the hourly MAs
If you are trading the NZDUSD (or thinking about it), there are some juicy MA levels that the pair is trading between and will help determine the next move for the bulls or the bears.
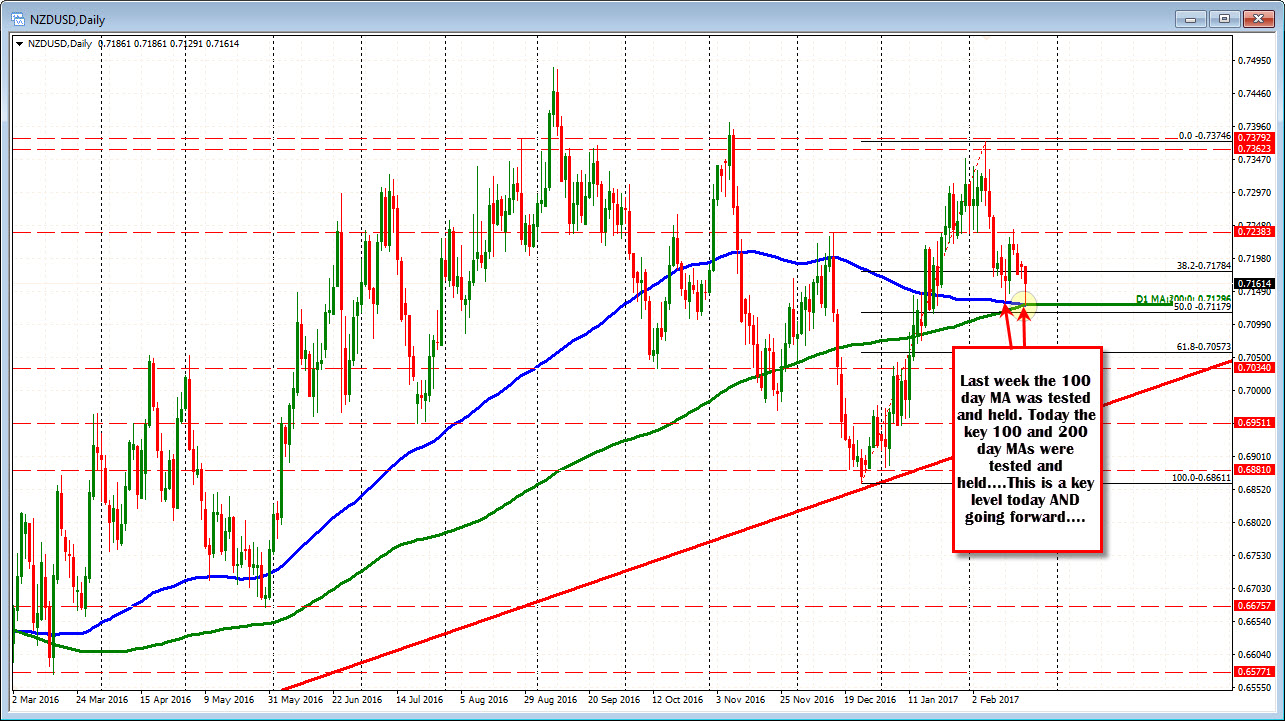
ON the downside, the pair stalled at the converged 100 and 200 day MAs (see blue and green lines in the chart above). They BOTH come in at 0.7128, and the today stalled at 0.7129. Nice hold. If this pair is going lower, those MA's need to be broken. Right now though, the buyers there have a nice risk defining level they can use.
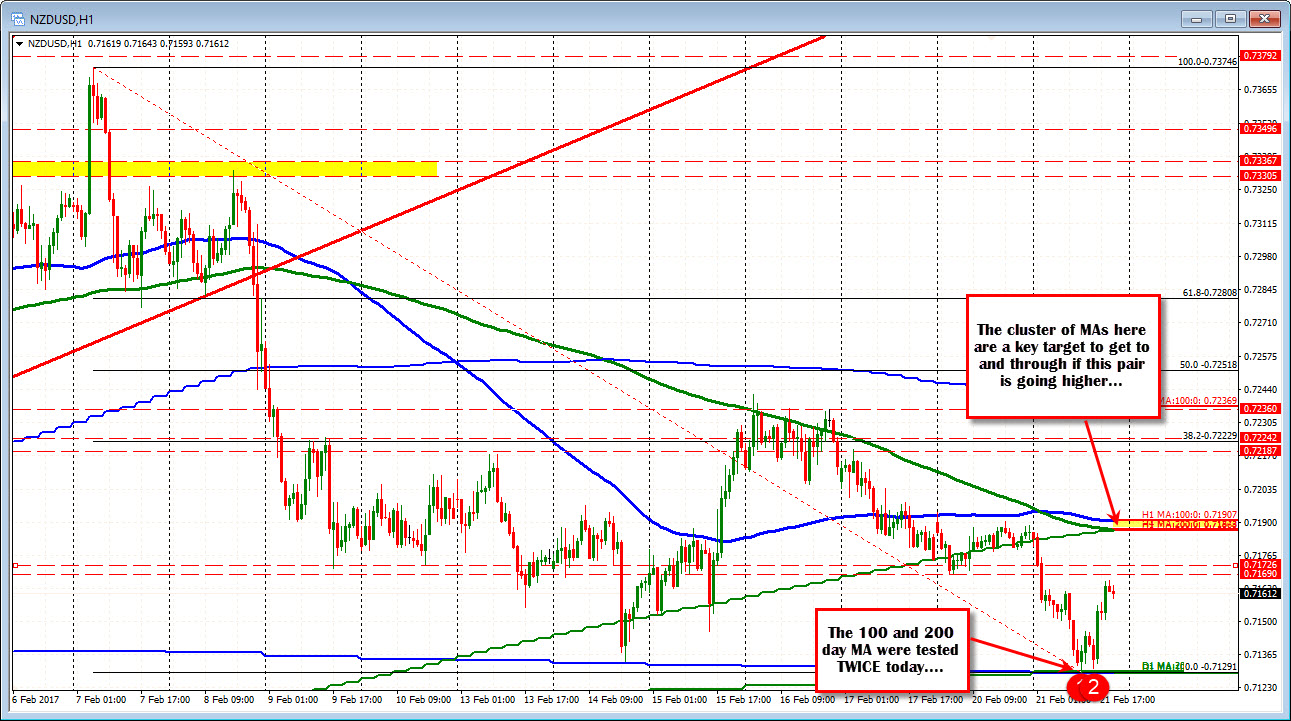
On the topside, looking at the hourly chart (see chart below), the:
- 100 hour MA (blue line),
- 200 hour MA (green line)
- 200 bar MA on the 4-hour chart (green step line)
All are near each other at 0.7186 to 0.7190 (within 4 pips of each other). If this pair is going to go higher, those MAs need to be broken.
So you might say it is the battle between the daily MAs below at 0.7129 and the hourly MAs above at 0.7186-90.
We currently trade between those "goal posts". At some time, the we will get a break.
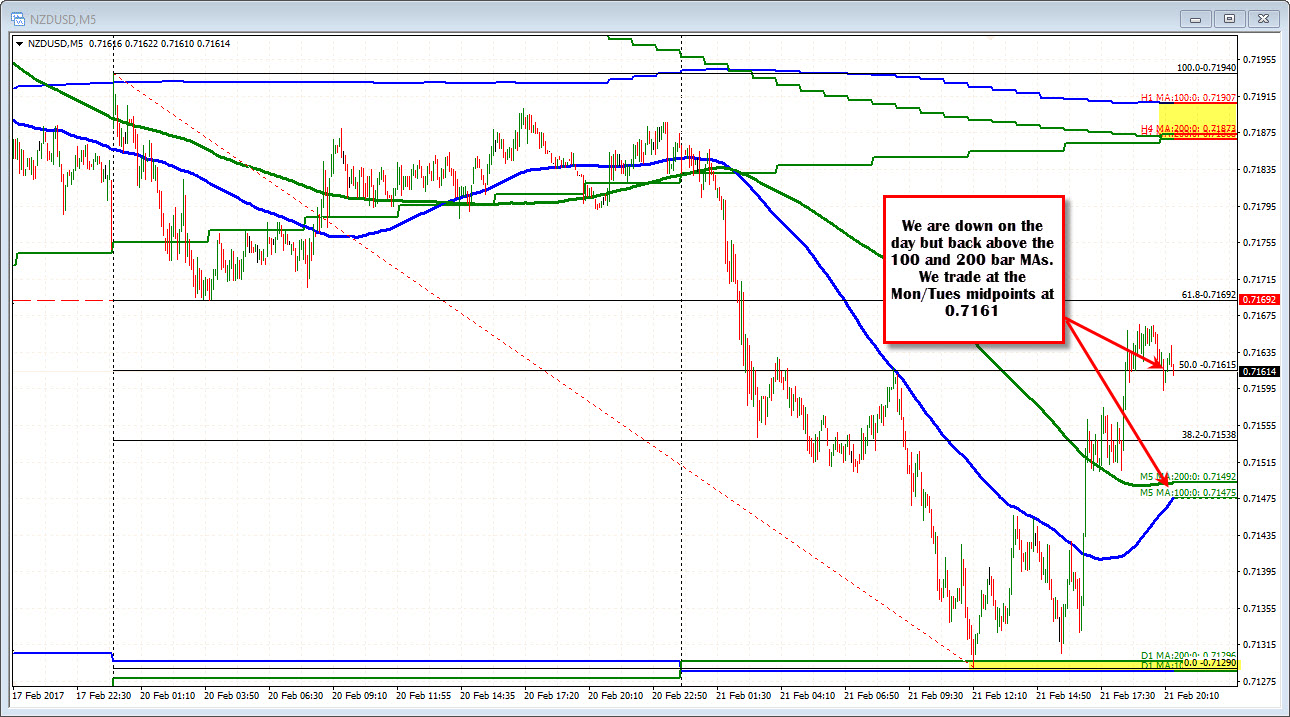
If you look at the 5-minute chart below, the price is lower on the day but has moved above the 100 and 200 bar MAs. We are trading right at the midpoint of the week's trading range. A little bullish. A little bearish.
There are some juicy technical levels. The buyers from below probably feel ok, but they are not in the clear. More clarity will come on the break of the hourly MAs above. That might not be so easy (or at least you can look for a fight from sellers against the level).

