
Quick moves on unexpected moves test the technicals
Quick moves on unexpected news tend to overshoot in the first few hours as stops are squeezed and fear takes over. The bounce comes as profits are taken and bottoms are picked.
The size of the bounce is often the best indicator of what's next.
Look no further than the intraday chart of USD/JPY, which fell by as much as 170 pips but has trimmed 65 pips from the decline in a bounce over the 38.2% Fib.
At the textbook level, above the 61.8% retracement is a 'buy' but until then, it's still time to sell.
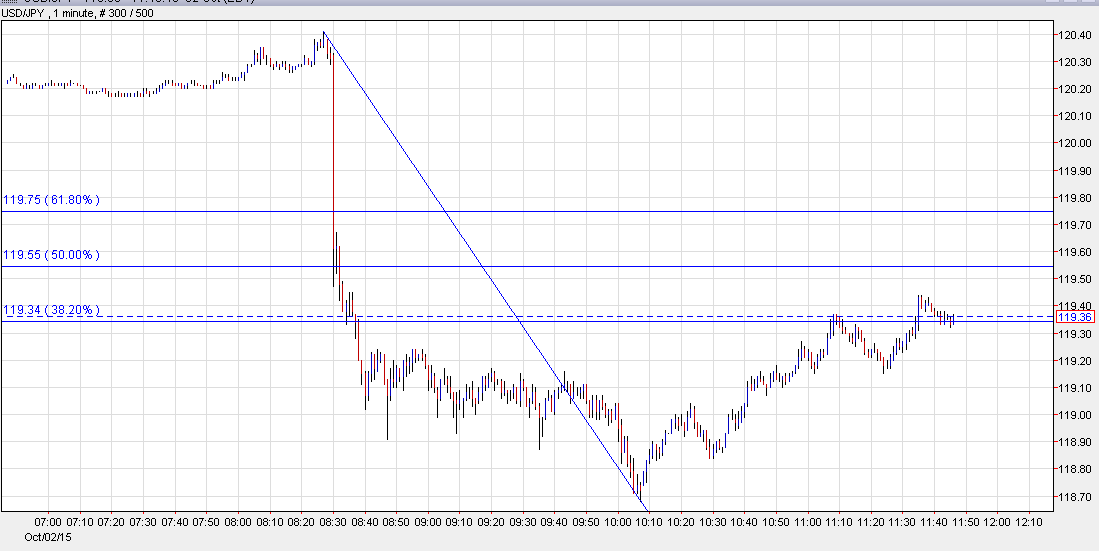
In the bigger picture, the fundamentals about what the weak jobs report means for the US economy is a tough call in the heat of the moment.
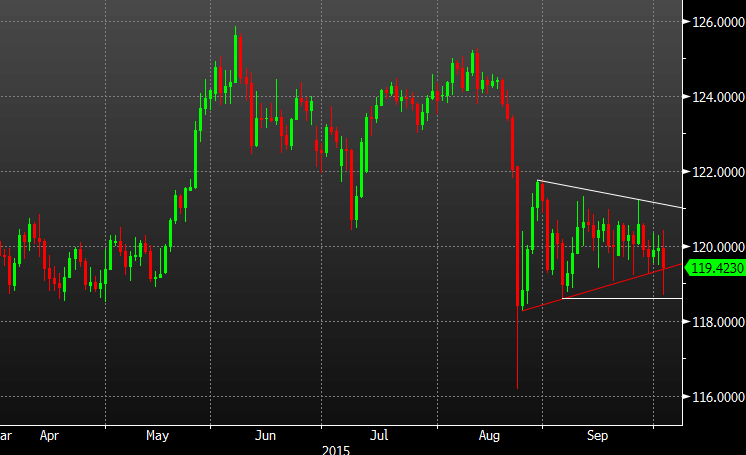
Another level to watch is the USD/JPY wedge on the daily chart. We shot through the downside but held the September low and we're back into the triangle now.
The final piece of the puzzle is that's it's now Friday afternoon. And few technical, fundamental or market questions are answered with only a few hours of trading remaining.
If you want to know more about Fibonacci levels and learn how to trade better, sign up for our educational mailing list.

