
50% of the move up from April low also in play
No secret. Trump risk, finally has taken some of the wind out of the US stock market.
The S&P is down -1.16%. The Nasdaq is down -1.68%. The Dow is down -1.14%.
Focusing on the broader S&P index, what are the technicals saying.
The pair has gapped lower from yesterday's bar. We closed at record levels yesterday as well. So that certainly is not a great thing technically. Where have be gone so far?
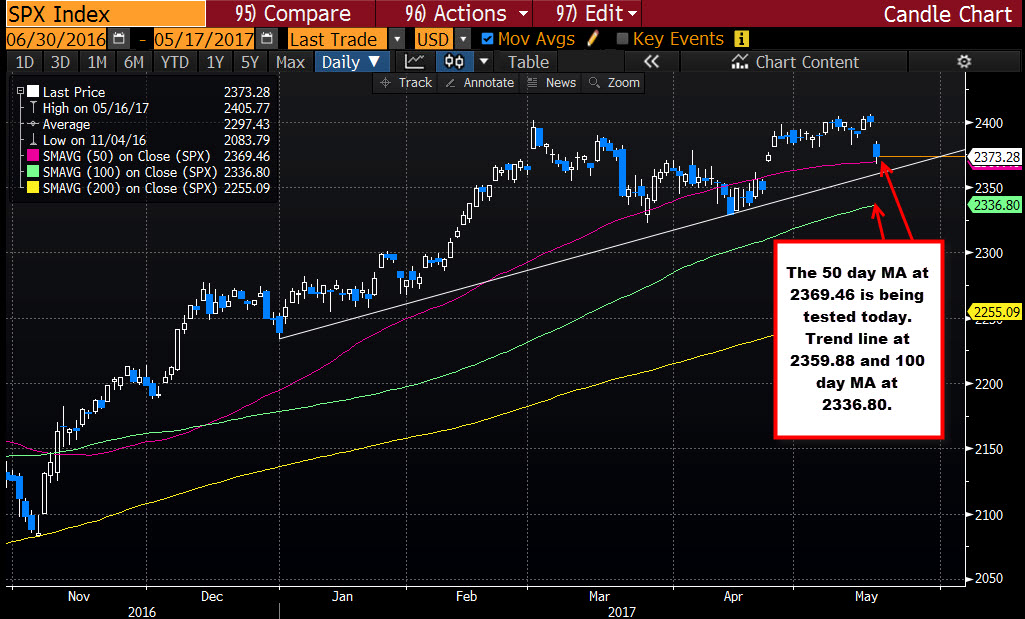
Looking at the daily chart, the 50 day MA comes in at 2369.46. The low today reached 2367.82. So there was a break of that MA, but we are seeing a bounce. Nevertheless, if there is a move back below that MA level, look for more selling and momentum lower. ON the daily chart a trend line cuts across at 2359.88. Below that the 100 day MA is at 2336.80.
Can we go there? Sure. The low from a month ago was below that MA level.
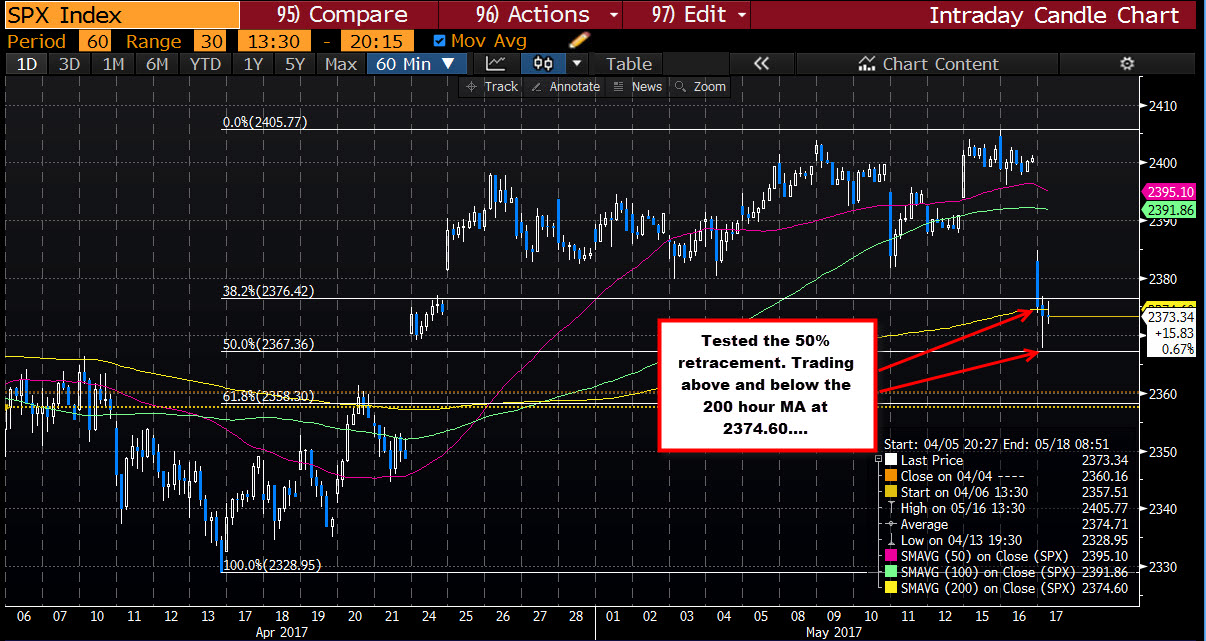
Drilling down to the hourly chart, the bounce today off the 2367.82 is better understood. Looking at that chart, the 50% of the move up from the April low comes in at 2367.36. That is just below the low for the day at 2367.82. The move lower gapped below the 50 and 100 hour MAs (at 2395.10 and 2391.86 respectively). The 200 hour MA comes in at 2374.60 (see chart below). The price is trading below that level now, but there has been some activity above and below, with the ceiling on the correction by the broken 38.2% line at 2376.42. That is shaping up as a key topside level now.
What to look for now?
If the S&P can stay below the broken 38.2% on the hourly chart at 2376.43, I think the sellers would remain fully in control. If the 200 hour MA at 2374.60 becomes a closer ceiling and holds, that is even more bearish.
On the downside, the 50 day MA at 2369.46 and then the 50% level on the hourly at 2367.36 are key. Move below and the door opens for more of a run lower.

