
USDCAD is looking precarious after test of 1.2900
The jobs report has helped USDCAD rise from the lows and now we're seeing oil slide from the highs. That's giving it some added wind in its sails
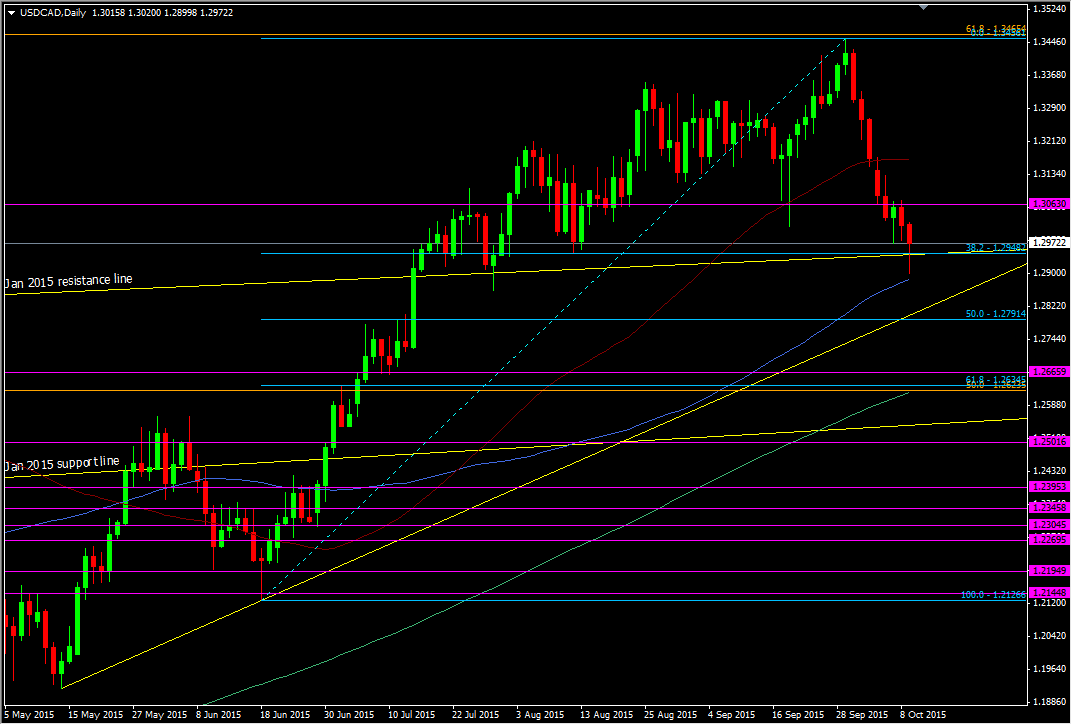
USDCAD daily chart
WTI has pulled up just short of 51.00 and the 200 dma at 51.34
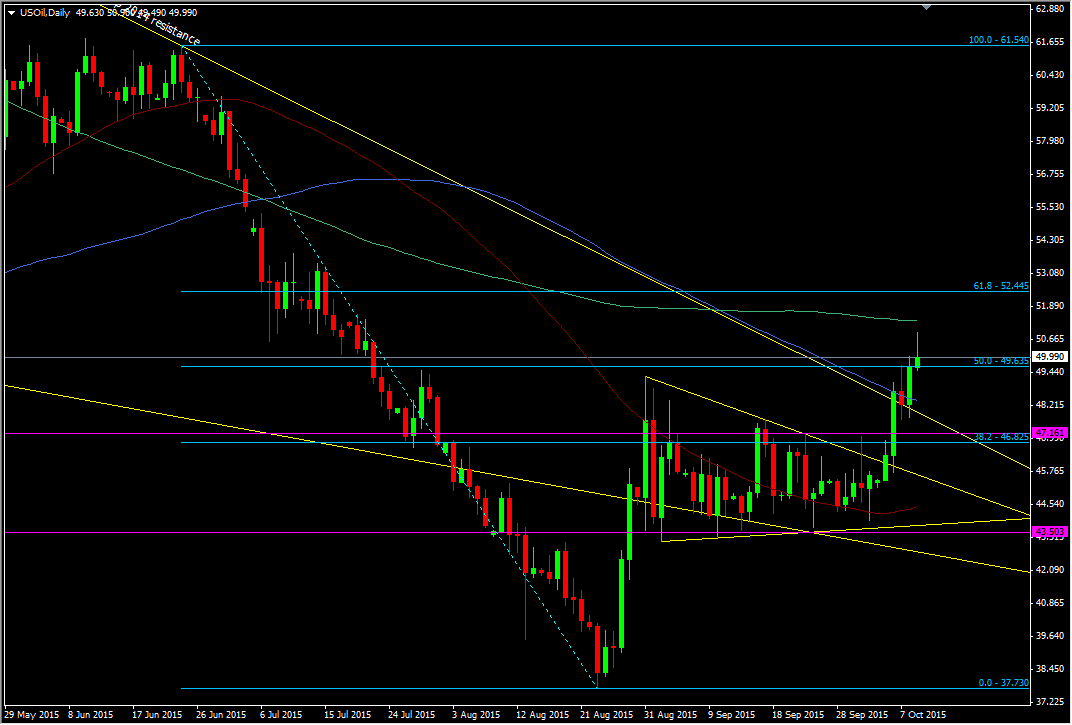
WTI daily chart
We're down to the broken resistance level at 49.60/70 and a hold here might turn it around once again, or at least halt the fall. That support might extend down to the 49.50 area
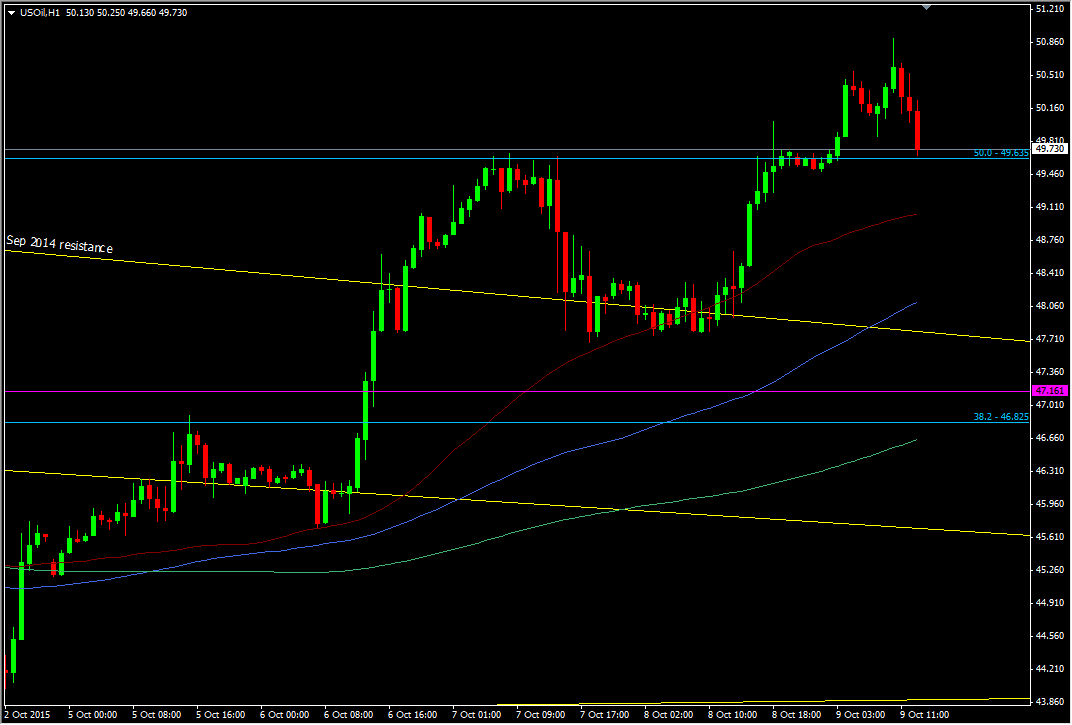
WTI H1 chart
It's tough to trade the loonie when you have to watch two markets but the tech levels still count so are still watching. We may see a bigger pick up in the downside for oil if traders take some of this weeks profits off the table. For USDCAD, we have resistance right here at 1.2980. 1.3000, 1.3020 and then the stronger 1.3060/75 level. Look for support to come in at 1.2940/45

