
Oil chart Elliot Wave technical analysis concludes the likelihood of a counter-trend rally to between $42 and $63
As long as the price remains above $26.09
(If you look carefully at the chart its for WTI futures)
The Goldman Sachs EW TA says:
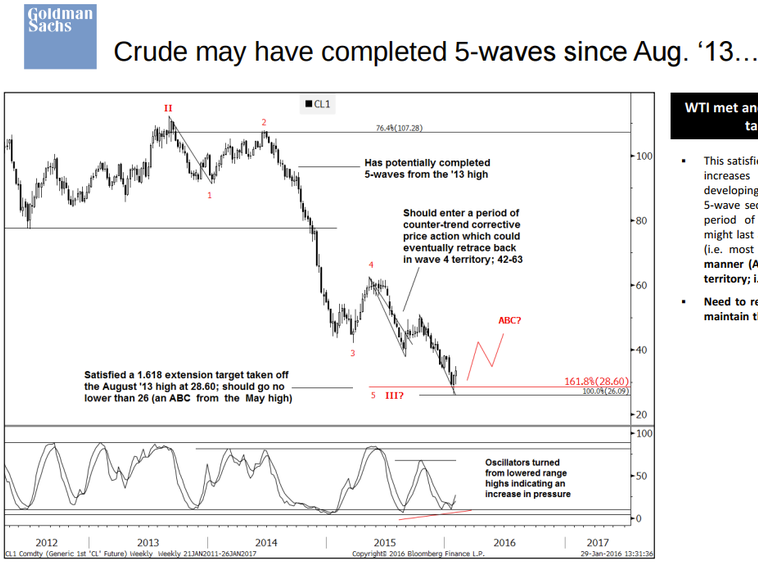
WTI met and has thus far held a 1.618 extension target from Aug. '13 at 28.60
- This satisfies the target for a 5th of 5-waves and therefore increases the likelihood of a counter-trend rally developing. As discussed in previous updates, once a full 5-wave sequence is in place, the market should enter a period of counter-trend price action. This correction might last around one third of the time it took to decline (i.e. most of '16). It should develop in a three wave manner (ABC) and eventually retrace back into wave 4 territory; i.e. between ~42 and 63.
- Need to remain above 26.09 (an ABC from May '15) to maintain this outlook
I'm not an Elliot Wave person, but if we have any reading who would like to comment on the GS analysis, please go ahead.

