Test trend line target
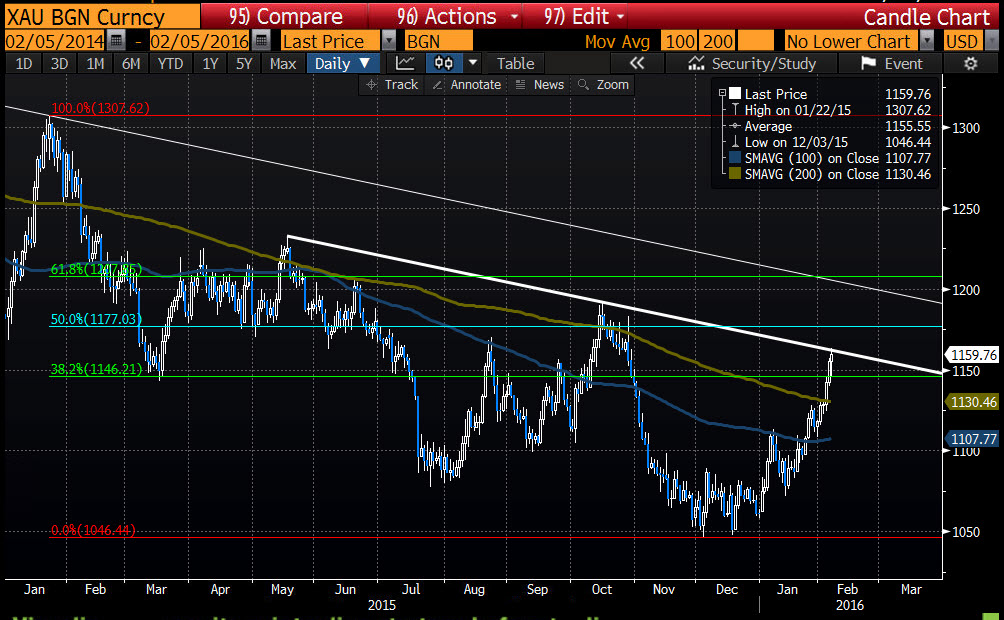
Gold continued to move higher today and in the process has tested the topside trendline connecting the highs from May in October. That trendline cuts across at 1162. The high price for the day, did extend to 1163.33 but the price has retraced back below that trend line.
A move above that level will next target the 1177 area which is the 50% of the move down from the March 2015 high. The price last week based against the 100 day MA (blue line in the chart below before heading higher) This week, the 200 week MA was broken (green line in the chart below). That MA currently comes in at 1130.46. The last time the price was above the 200 day MA was back in October. That MA represents a risk level for those who are long now. Stay above and get above the topside trend line will have more traders looking for the either safety of Gold or since rates are low and even below 0% in some countries, a store of value.