
Down and back up. For the week, the sellers had a shot to go lower and failed. The buyers had a shot to go higher and failed.
The intraday price action took the price lower into the NY opening and then back higher in the NY session so far. The NY session high nearly completed a lap - falling just short of the London and Far east highs at 1.2187 and 1.2188. The NY session high 1.2186.
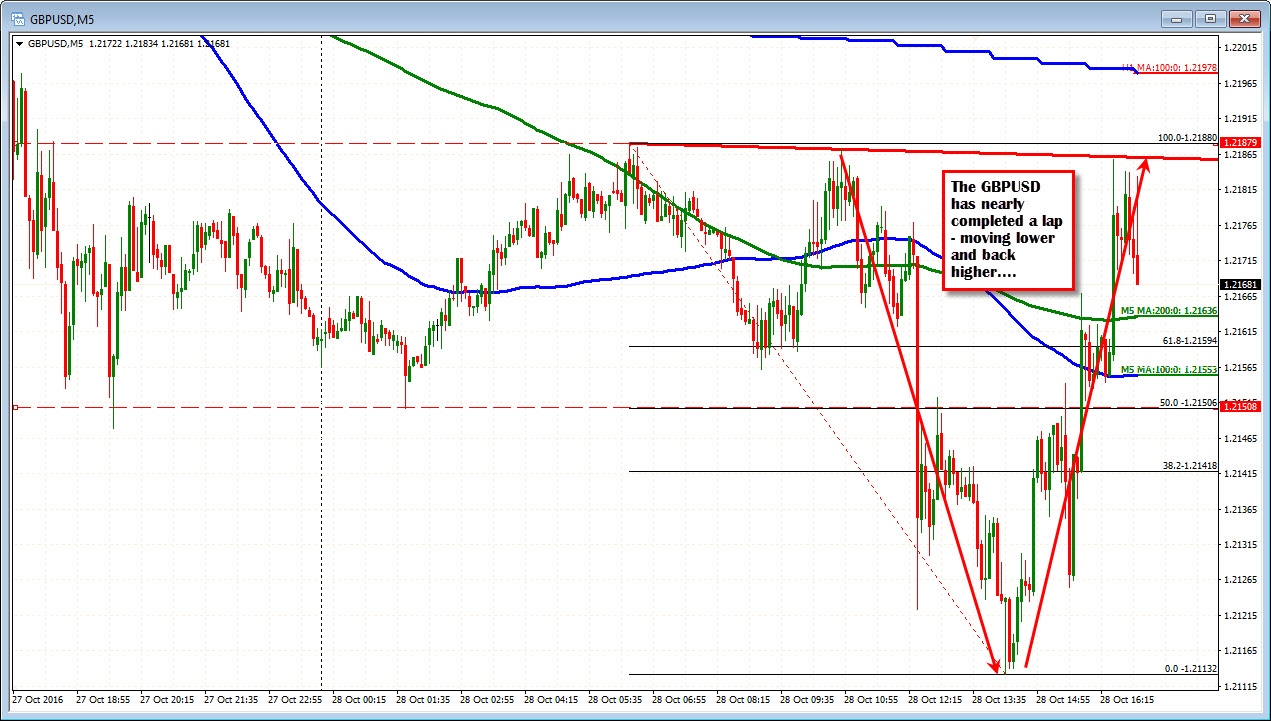
We are trading near those highs with the 100 hour MA looming overhead at 1.21986 (see blue line in the chart below).
Looking at the price action this week:
- Moves lower and higher showed rejections on the breaks.
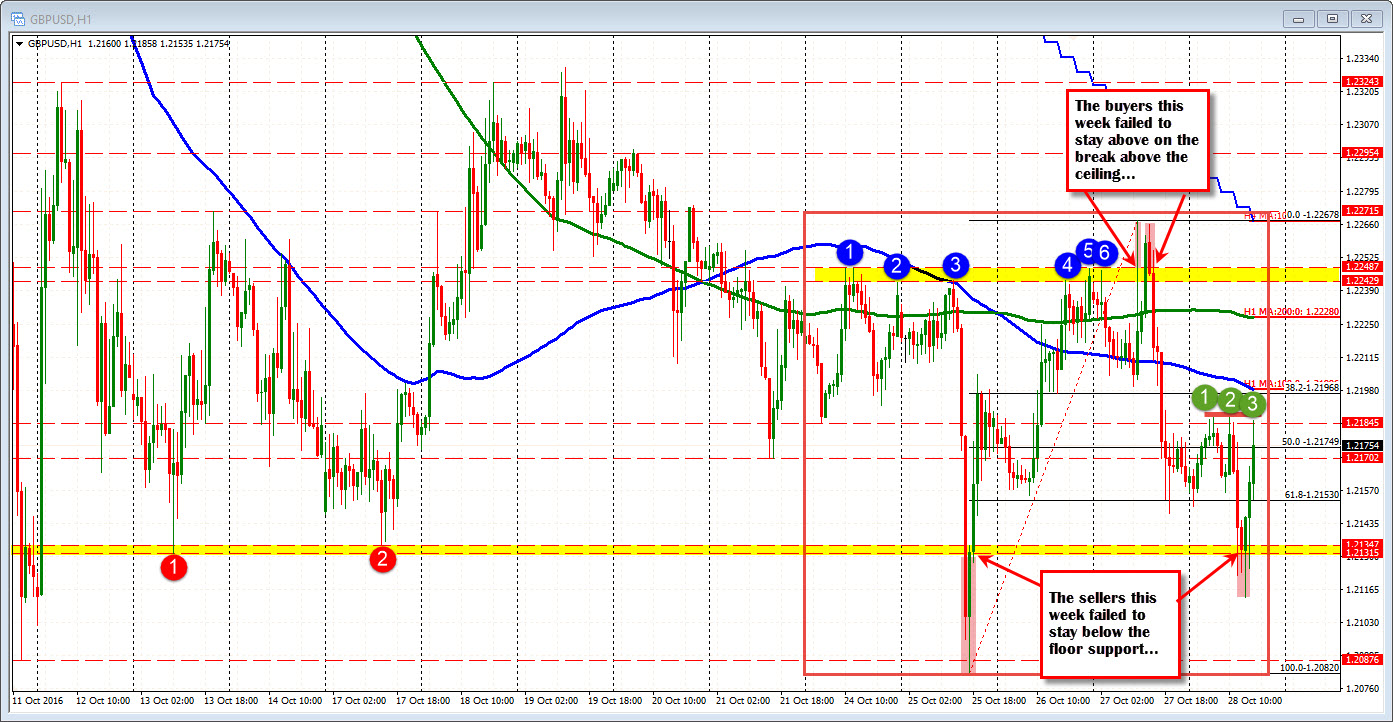
- Today and on Tuesday, the price moved below a support area t the 1.2131-347. Each were rejected.
- Yesterday, the ceiling at the 1..2242-487 level was broken on two separate occasions and each time it failed.
- Overall there were 11 hourly bars that traded outside 1.2131 and 1.22487. That is just 117 pips where most of the trading was centered. That is not a big range
The midpoint of the weeks trading comes in at 1.21749. We are trading around that level, but we are below the 100 and 200 hour MAs.
So...for the week, traders seem to be in a mode where they like it sometimes (bullish) and don't like it other times (bearish).
Given the pair is near 3 decade low levels, I guess, the sellers remain more in control. The buyers need to show they can get and stay above topside technical levels like the 100 hour MA near 1.2200 or the 1.2250 area too (high yellow area in the hourly chart above).
At the same time, the pattern shows that breaks below 1.2131-35 fail - that needs to change . Also below that, the 1.2080 area needs to also be broken and remain broken - in order to go to the next downside targets (like seeing what life is like below 1.2000).
In the meantime, traders will look for the little patterns (like the ceiling in trading today) and just trade little trades.

