
Time to stick some pins in the charts and look at the technical levels over the FOMC
Trading the actual release is going to be tough so here's a look at some levels that may contain any moves we get
USDJPY
UP
- We continue to chip away towards 124.00 pre-FOMC and there's tech resistance at 124.10/15 and Japanese exporter offers at 124.20. All that is going to be too close to the current price to contain a move.
- Higher up at 124.45/50 we have resistance level that's been strong since late May. If the FOMC is very deadpan then this level might hold but it is still quite close also so use some caution. We might find we kneejerk through it and then quickly come back below. If we do (to say 124.70/90 before coming back) then the level is likely to come into play a second time around
- 124.65/70 is a minor resistance level, as is 124.90.
- We'll get natural resistance at 125.00 and that might be where any mild hawkish comments start petering out
- On anything very hawkish, the June highs up at 125.65/70 and 125.85 mark stand in the way of 126.00 and if they go then we could well see a decent push higher, and it's pretty open up there meaning 130 could well be on the cards
Down
- We know the dippers won't give up on disappointment so expect the downside to be hard work. We've seen support today ahead of 123.50 and the late Asia/early European lows at 123.30. We also have the 100 & 200 H4 ma's floating around there too
- 123.00 is another one of those levels that we see S&R at and that could well feature strongly if the buck is disappointed
- 122.70 is a minor support point with 122.45/50 looking stronger
- It's doubtful we'll get any news to really sink the pair but 121.50/55 will bring out the big dip buyers should 122.00 get smoked
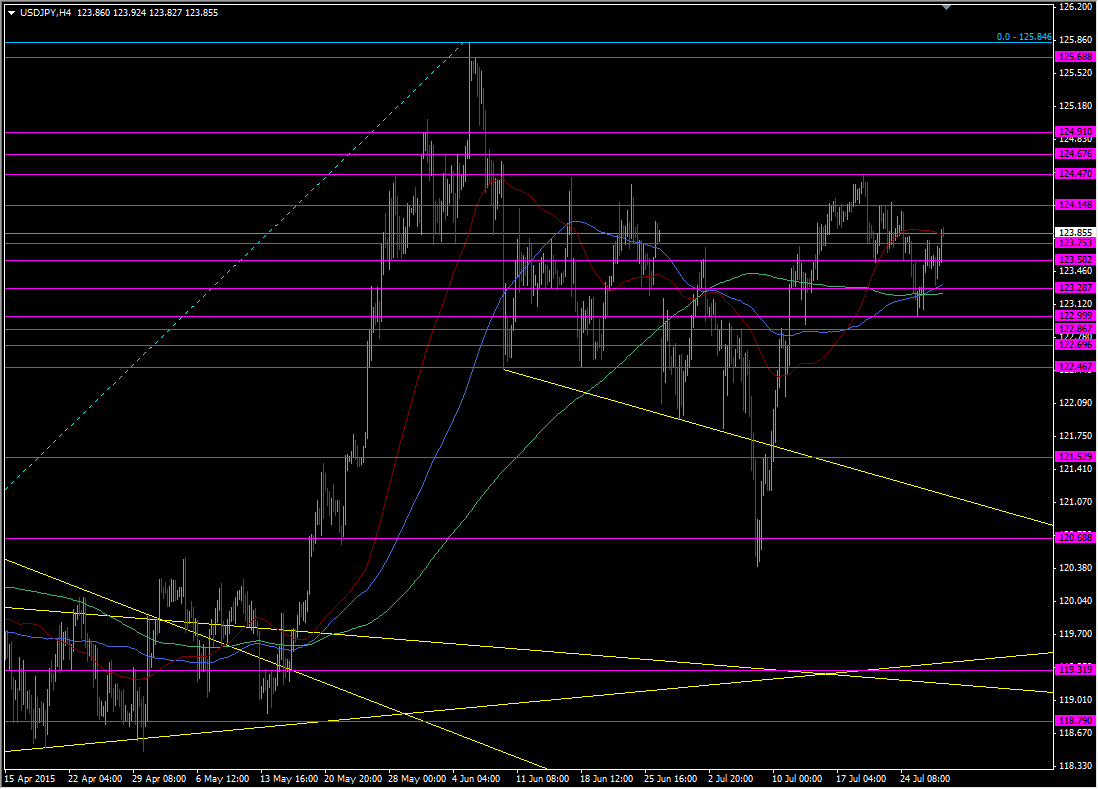
USDJPY H4 chart
EURUSD
UP
- The day's highs at 1.1084 might hold on a bland FOMC but that will depend on where we are over the next minutes leading up to the announcement. The 200 H4 ma is at 1.1089 also. If we push lower before then that will strengthen the level by increasing the distance factor. 1.11 will have it's own resistance too, including the 55 dma at 1.1097
- We've been following a minor trend line down from late June and it's at 1.1118 at today's money. The fact it's so short term means I don't place too much faith in it
- 1.1125/30 has seen action since April and this will be the better level to watch instead of 1.1118
- Break that and we could have a decent try towards 1.1200, with only 1.1180 standing in the way. We're talking around 150 pips to that high area so we're going to need to get a very dovish Fed to see that tested
Down
- The 100 H4 ma sits at 1.0985 with a stronger level at 1.0965/70 & 55 H4 ma at 1.0955
- 1.0915/20 comes next and 1.0880/85 has seen big interest from buyers on the order boards recently and 1.0865 held support a week ago
- 1.0820/25 is looking a very big level and due to the fact the biggest risk is a hawkish Fed, this will be a very key level. If it goes then we have the potential for a decent move down towards 1.0665
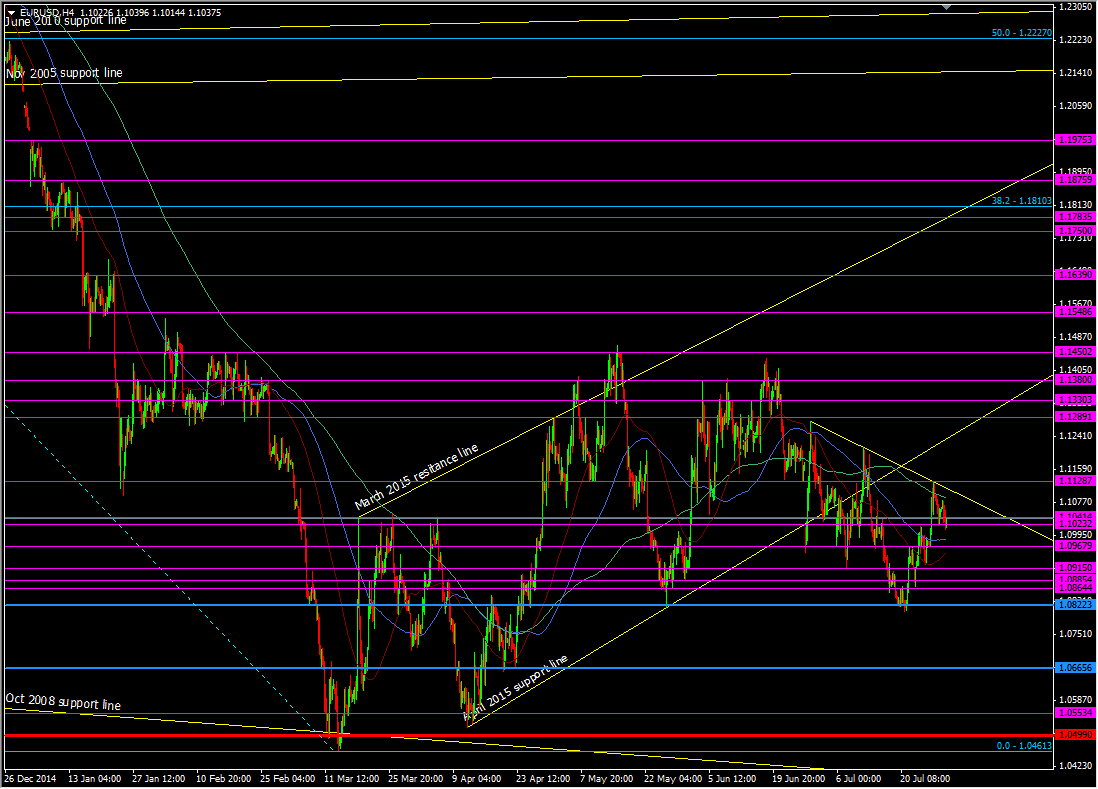
EURUSD H4 chart
GBPUSD
Just a quickie for the pound as time is getting on
UP
- 1.5675/80 comes back into play after the drop from there earlier
- 1.5700 has played the S&R game back in late June, and had a says in events back in late 2014
- 1.5735 played the same game in that Nov/Dec period
- 1.5785/1.5800 were the high points in June following the fall from the 1.59's
Down
- Much like the dollar pound buyers will be looking to hoover up any falls in readiness for the BOE. The 55 H4 ma at 1.5575, the 100 H4 ma at 1.5543 and the 1.5520 low yesterday looks like decent levels to watch
- 1.5480/85 looks minor and 1.5450/65 looks stronger
- The low 1.54's holding the Jan 2009 support line and prior S&R at 1.5420/30 look good for a stretch point with added support from the 100 dma at 1.5395
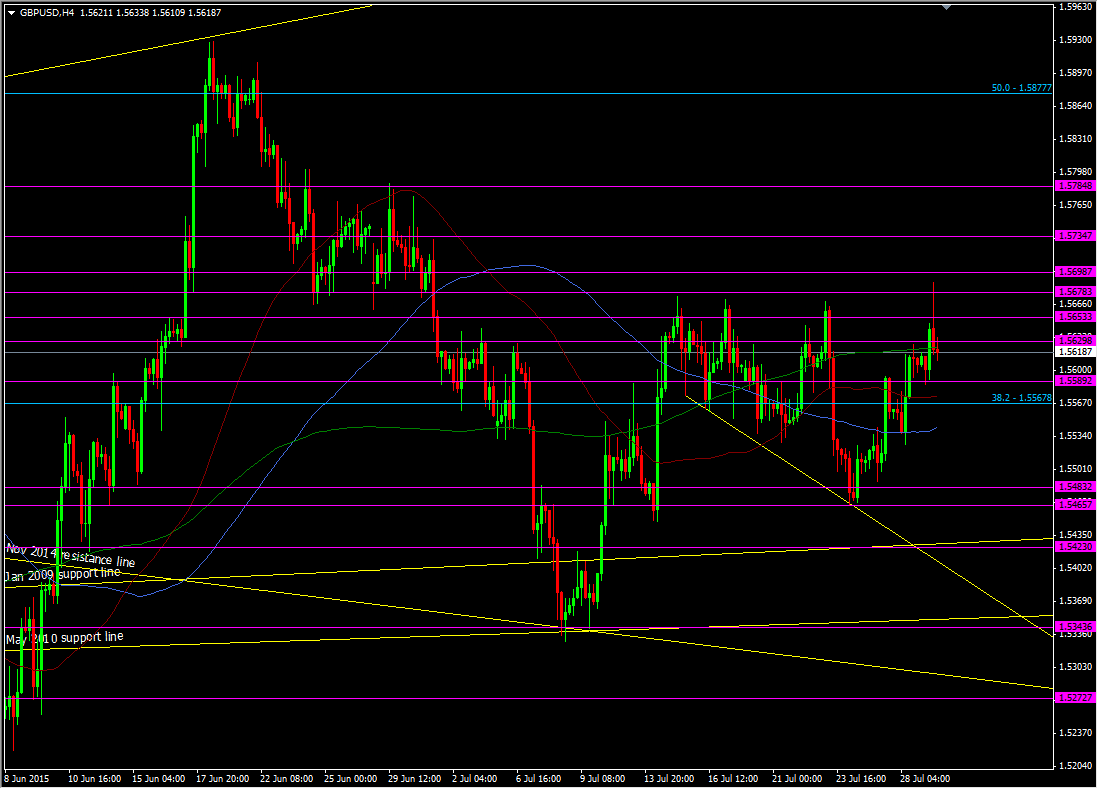
GBPUSD H4 chart
That's the levels and we have 20 mins to go

