50% and 200 bar MA on 4-hour chart at 111.23-24
On Friday, the price of the USDJPY moved above and closed above the 200 bar MA on the 4-hour chart AND the 50% of the move up from the April low at the 111.24 area. The price closed each 4 hour bar since then with the exception of the closing bar on Friday. The price for the week closed at 111.18.
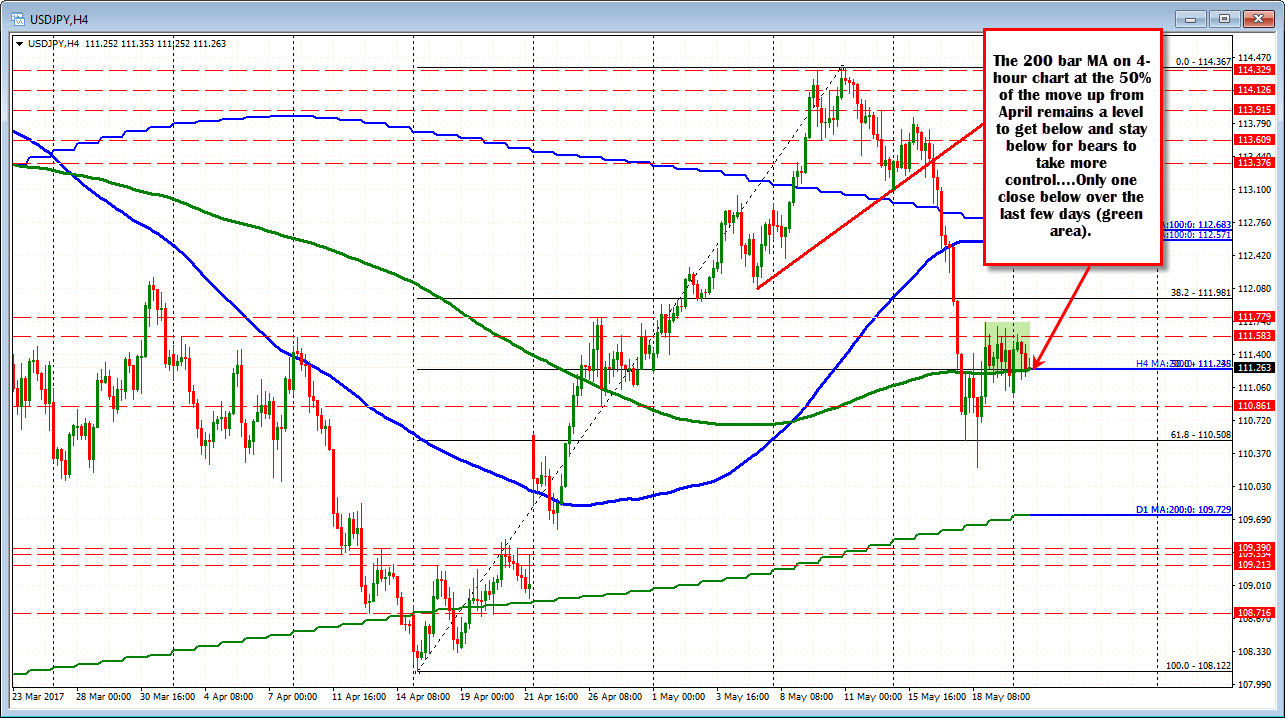
Today, the price opened lower but moved up from the first 5 minute bar. The price has closed above the key level. We have traded below the key level in the London session (including the last hourly bar), but has not closed back below the level (the London low is 111.144).
For me, get below and stay below puts the bears more in control.
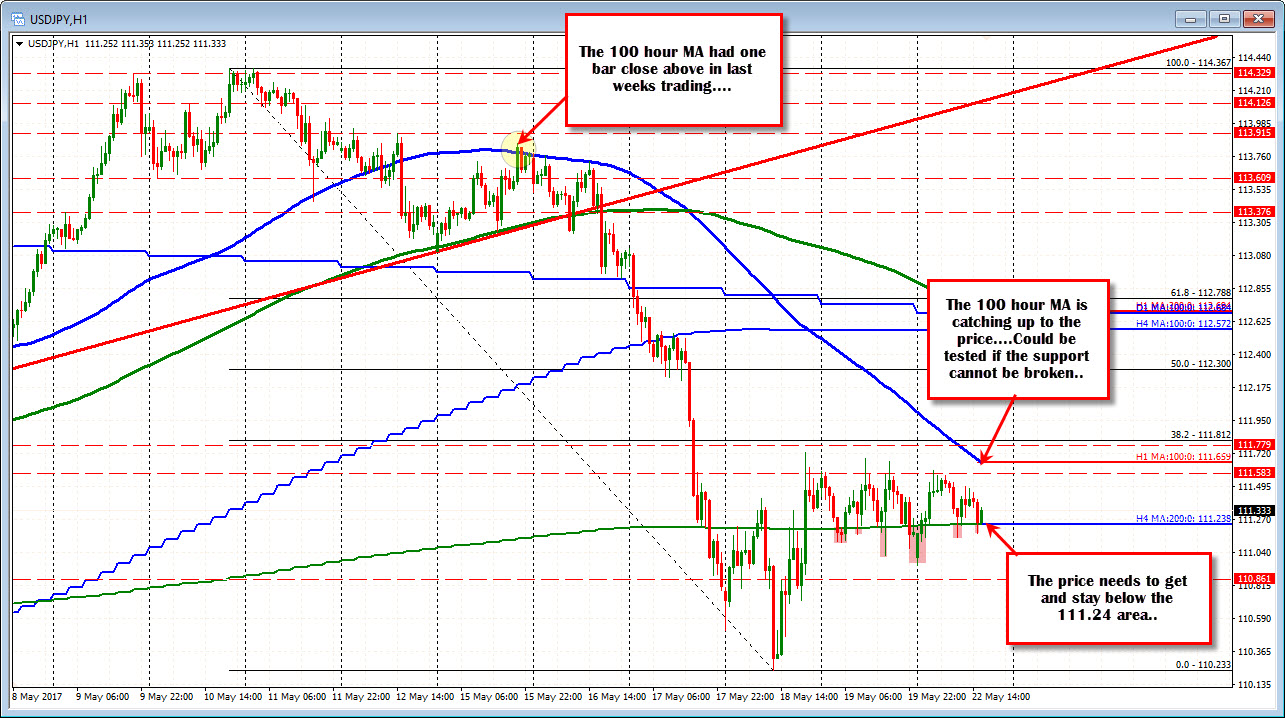
Looking at the hourly chart, the 100 hour MA at 111.658 is close to catching up to the price. Last week, there was only 1 hourly bar that closed above the MA level (that was on Monday). If the support level cannot be broken, look for test of that MA line later. A move above, should solicit more buying.
PS the USDJPY has 1.03 B) of option expires at 111.40-50. That could keep a lid on the pair on a rally in the next 30 or so minutes (until 10 AM ET).