Tests the close from Friday
The USDJPY is currently down testing support against the close from Friday at 118.89.
- The 118.89 close from Friday equals the low close on April 17 and represents the lowest close going back to February 25.
- Below that level, the 50% of the five-month trading range comes in at 118.783, and
- Lower trend line support comes in at 118.646.
- The low for the month is at 118.52.
- The low for the month of March is at 118.318.
Needless say, with the market consolidating over the last few months, there are a lot of levels that are close by. Nevertheless, they each need to be broken to keep the momentum lower continuing and each has their own importance.
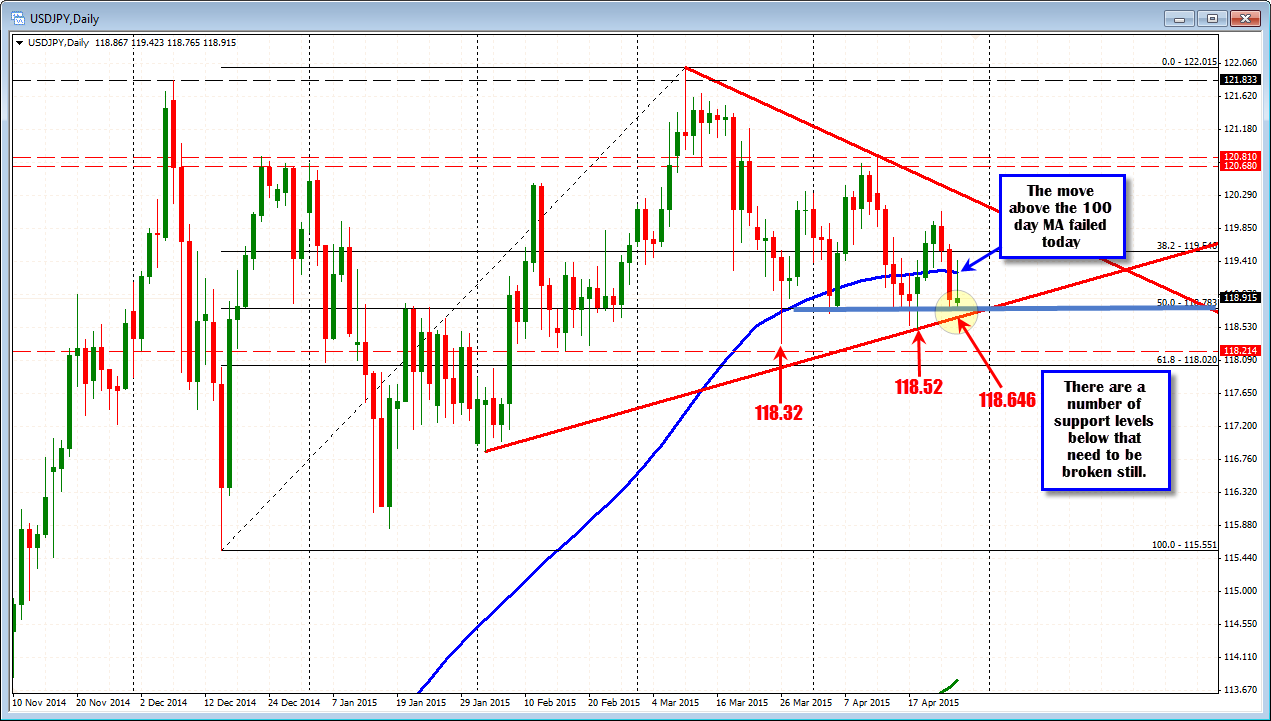
What we do know about today's trading is that the price of the USDJPY rallied to highs in trading today on the back of a downgrade of Japan from Fitch. That rally took the price above the 100 day MA (blue line in the chart above) at the 119.27 level It also moved above the 200 hour MA (see green line in the hourly chart below).
However, the high price for the day stalled at the 50% retracement of the move down from the April 22 high (see chart below) and weaker US data helped push the price back below both the 200 hour moving average (green line in the chart below) and 100 day moving average (at 119.266). The bias quickly shifted from more bullish to more bearish.
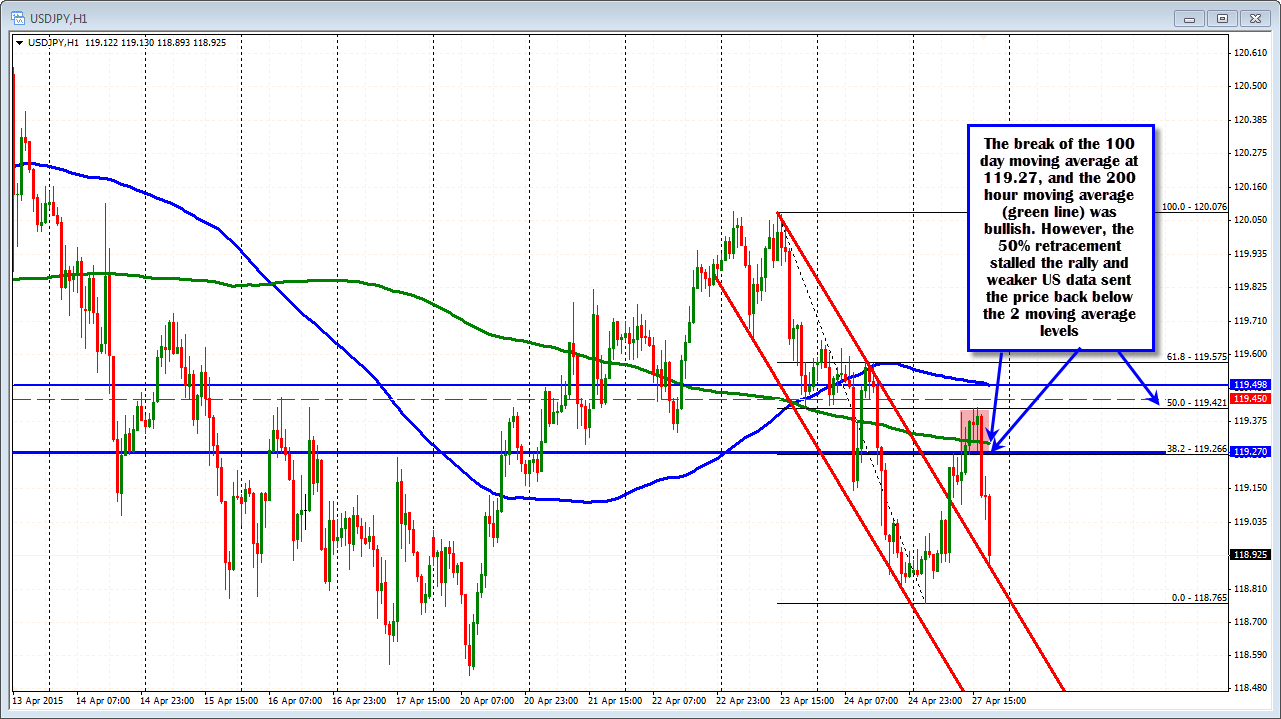
In addition to the aforementioned support levels off the daily chart, the pair is down testing the underside the broken trend line as well (see hourly chart above). This seems to have stalled the decline.
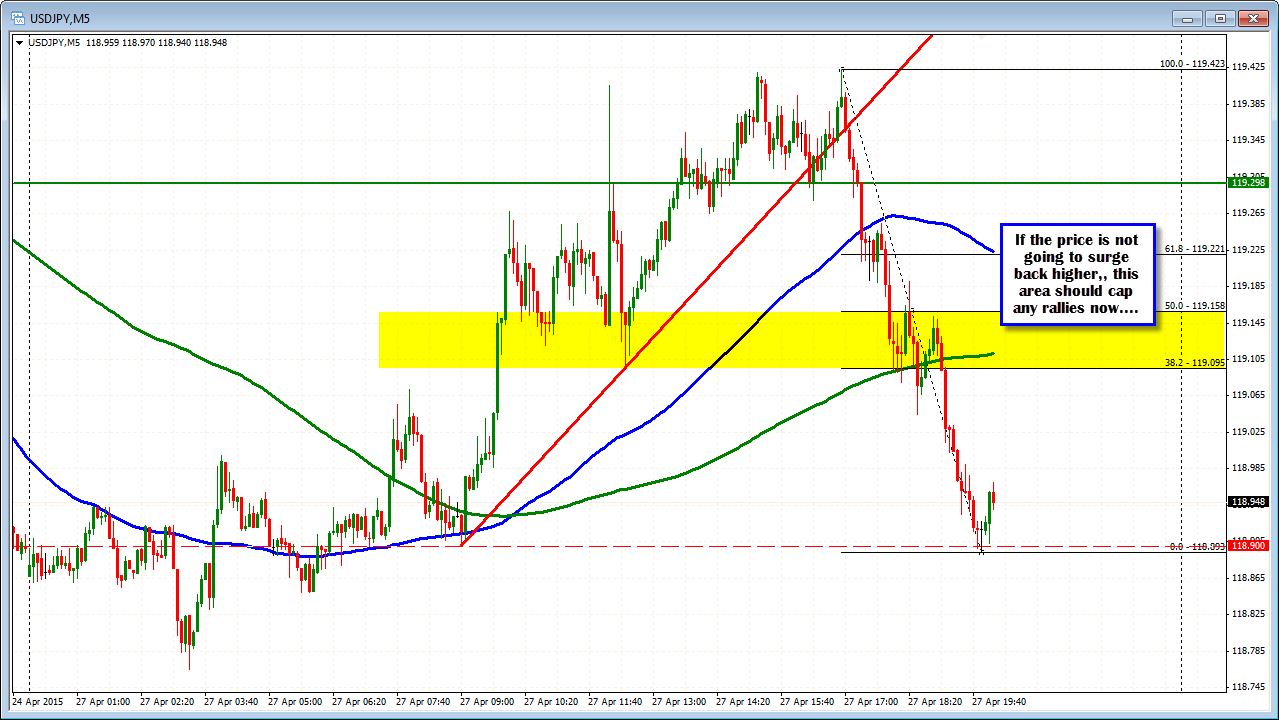
Resistance above now comes in at around the 119.10 level. This is near the 200 bar MA on the 5 minute chart and the 38.2% of the days range. For those looking for a bounce from the lows (i.e. buy against support here), the 119.10 would be the first major target.
Lots of support but the price bias is lower for the time being, and the failure of the breaks above the 100 day MA and 200 hour MA, have soured the bulls mood.