It is a step in the bullish direction
The USDJPY has been trading in a up and down fashion today. The range for the day is a low 62 pips (the average over the last 22 trading days is 94 pips). The low extended to 120.60.
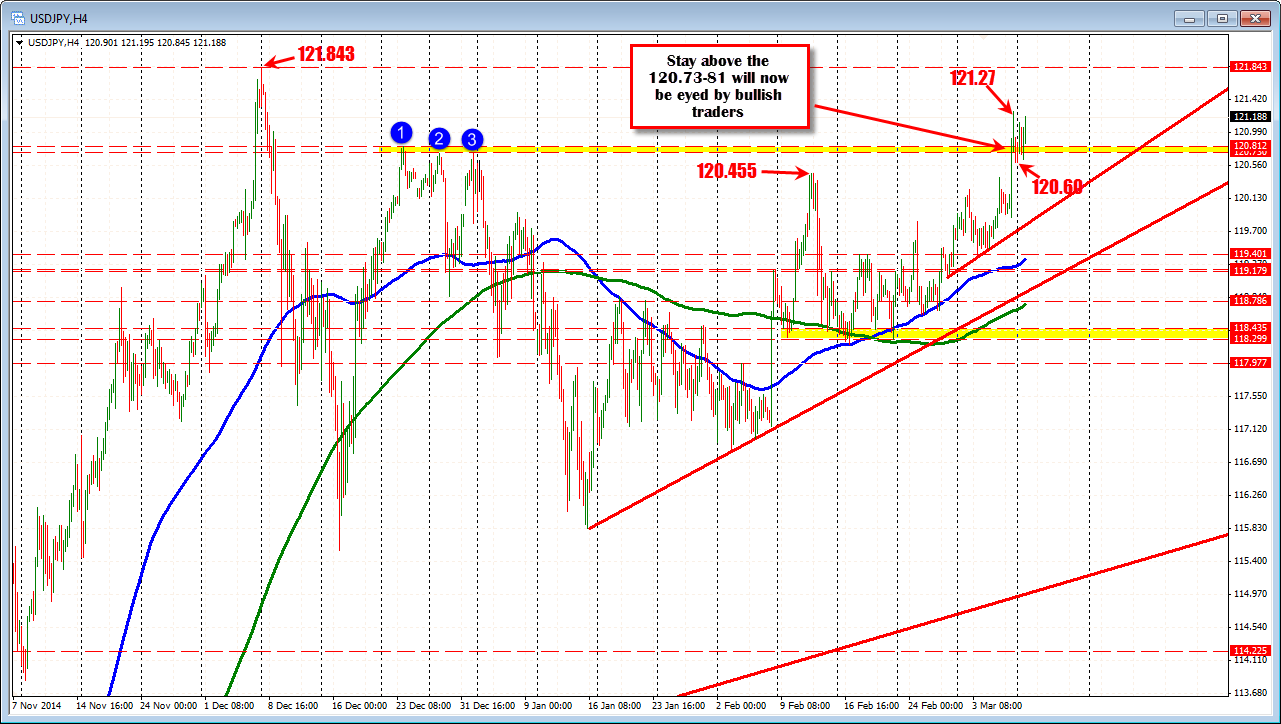
Looking at the 4 hour chart above, the swing lows for the day moved back below the 120.73-81 area (see yellow area in the chart above). That area defines the 3 swing highs from December 23, December 29 and January 2. On Friday, the price moved above this level on its way to a peak of 121.27.
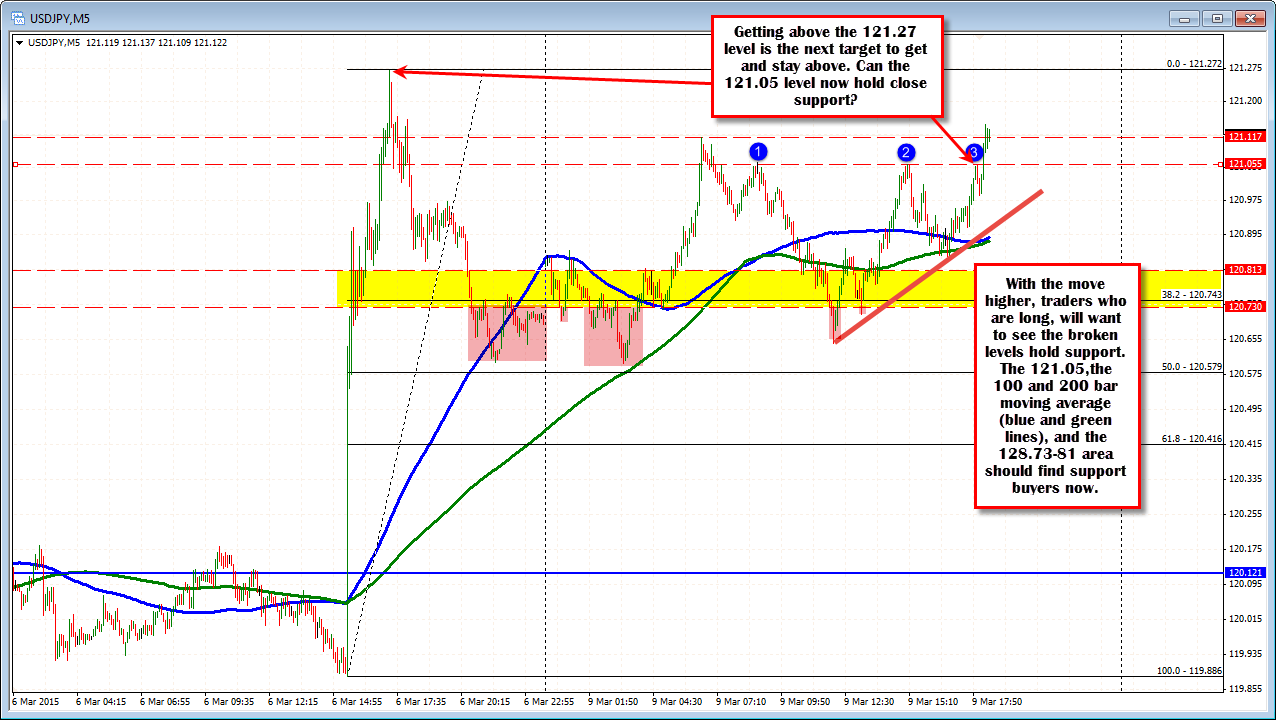
The corrections seen on Friday and again today have held above the 50% (keeps bulls in charge - see 5 minute chart below). However the lows have extended below the 120.73-81 area. The market was showing a reluctance to go higher. Is that changing?
In the current move higher, the price is once again moving away from the 120.73 to 120.81 area. It is also been able to break above the 100 and 200 bar MAs (blue and green lines in the chart below), and a temporary ceiling at the 121.055 area (3 highs stalled there - see chart below). All of this seems to be giving the pair a kick higher as London/European, traders look to exit for the day. Is the correction phase over? Can the market now focus on the next topside targets including 121.27, and the 121.84 high from December 8.
Watch for 121.05 to be close support/risk defining level now. I am not totally convinced but if that support can hold, perhaps it can extend the years trading range and test the 2014 highs soon.