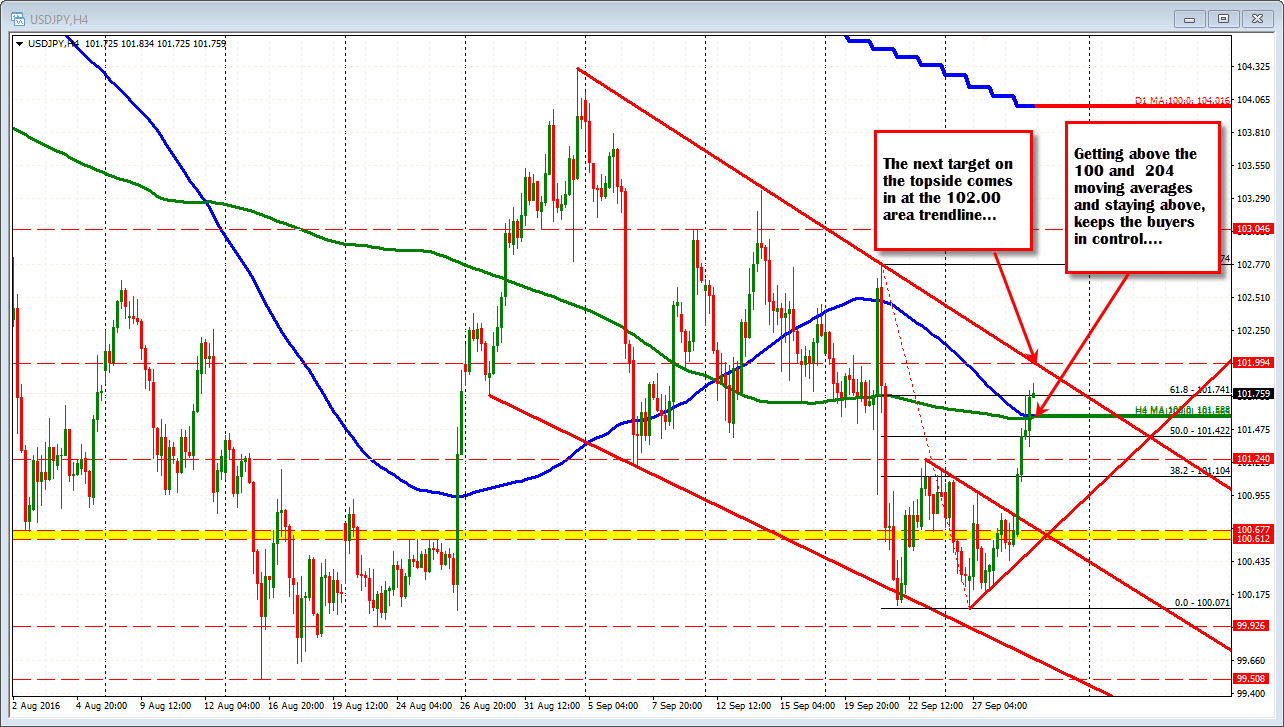
Moves above averages
The USDJPY as extended to new session highs in the process is breaking above moving average resistance defined by the 100 bar moving average on the 4-hour chart and the 200 bar moving average of 4- hour chart (see blue and green lines in the chart below). Those moving averages come in at 101.56 and 101.58 respectively. They are now support/a risk defining level for the longs - stay above and the buyers remain in control. The next target on the 4-hour chart is topside trend line at the 102.00 level (see chart below).
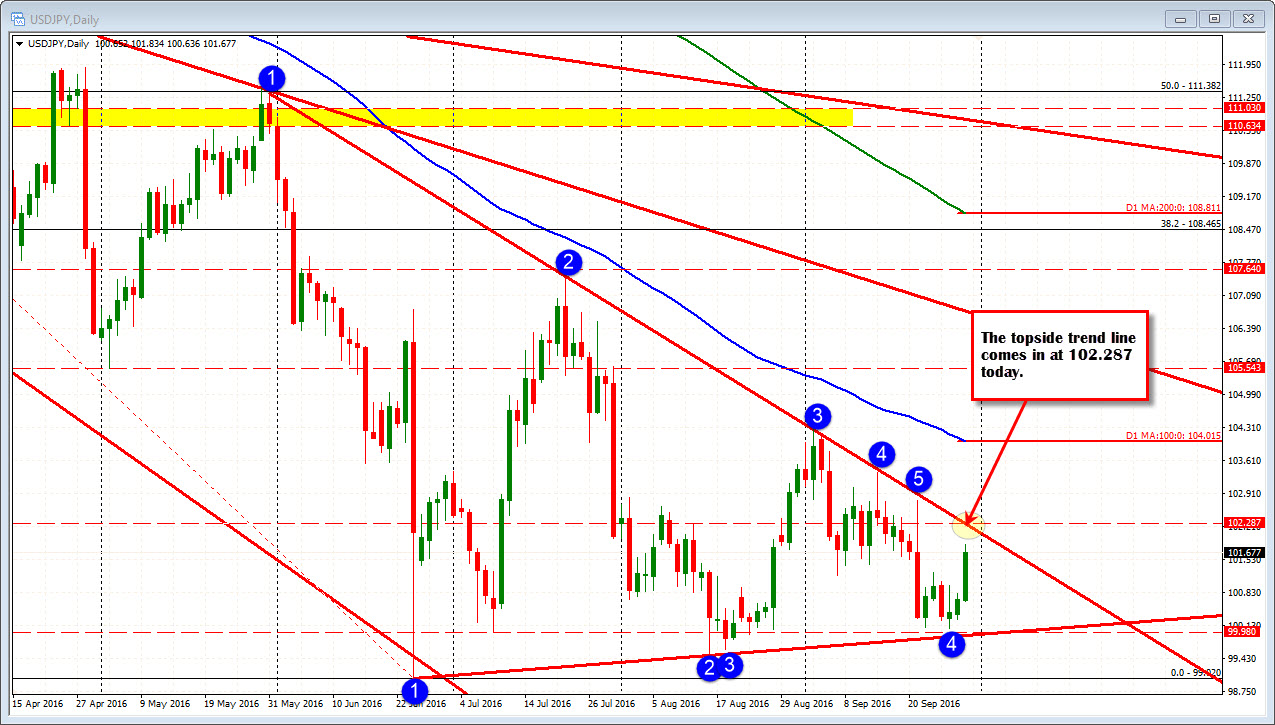
Looking at the daily chart, the USDJPY has been confined by trendlines on the bottom and top. On Tuesday, the price tested - well got close to - the lower trend line. Today we are seeing a surge to new week highs. The topside trend line cuts across at 102.28 currently (and moving down). At some point, a trend line break (either above or below) will help drive the price trend. At the moment, the price is between the two extremes.