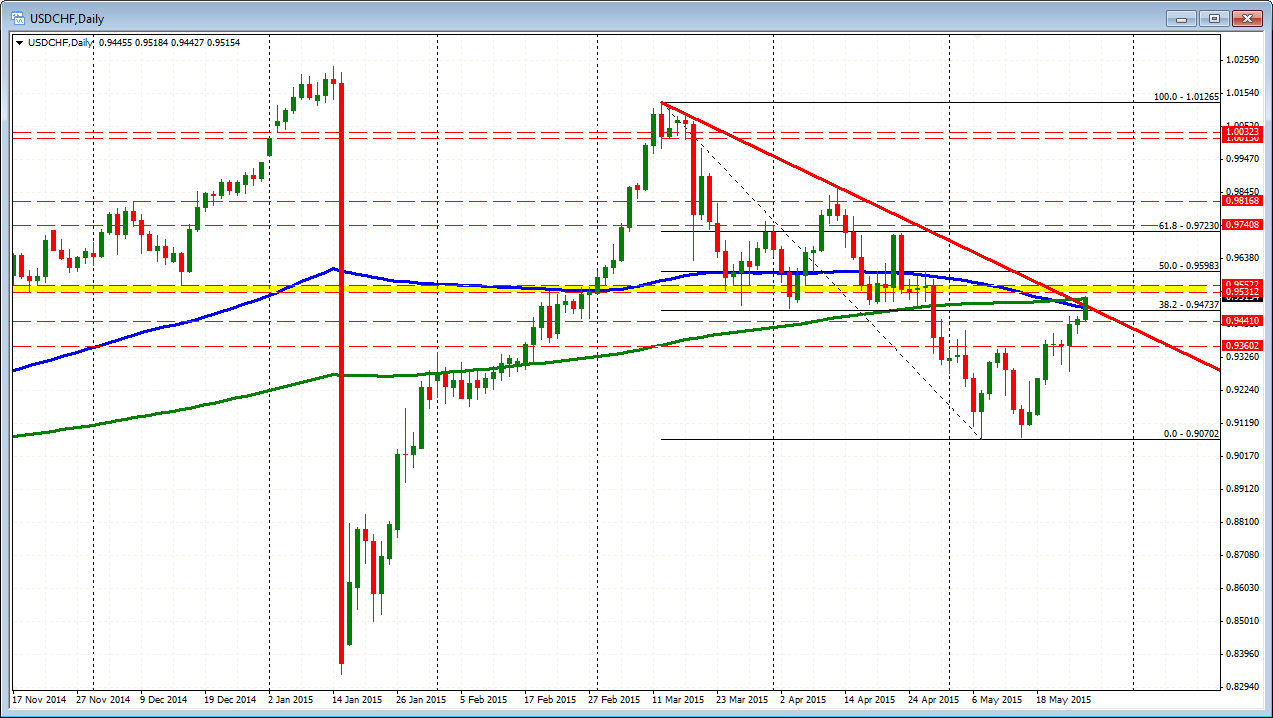
100 & 200 day MAs. Trend line too
A quick look at the USDCHF shows the price breaking above the 100 and 200 day MA and a trend line connecting highs from March and April. The highest level is the 200 day MA at the 0.95126. The 100 day MA is at 0.9482 and between is the trend line at 0.9490. The yellow area represents the low corrective prices from Nov and Dec of last year - prior to the USDCHF tumble on the back of the SNB depegging of the EURCHF. Those levels come in at 0.9532 and 0.9552 respectively. I can't say it was a great technical level in April when the price came down to the area If anything the price stalled near the level. Nevertheless, they along with the 50% of the move down from the March high at the 0.9598 will be targets if the buyers./bulls remain in control. Close risk will be the 200 day MA now (at 0.95126).
Trade balance data will be released on Thursdayand GDP for 1Q will be released on Friday. The Q1 GDP is expected to come in unchanged on the quarter despite the surge in the CHF due to the SNB action in January. Ironically, the CHF is weaker today despite increased anxiety about Greece and European and US stock markets which are tumbling lower. No flight into the relative safety of the CHF.