Will have oil influences this week...
As headlines swirl around about OPEC, the USDCAD trades up and down today. The pair just tested a level I think is important on the downside and held. It was new lows for the day, but the 100 hour MA and the lowest swing low going back to September 14th held (at 1.3129 and 1.31279 respectively).
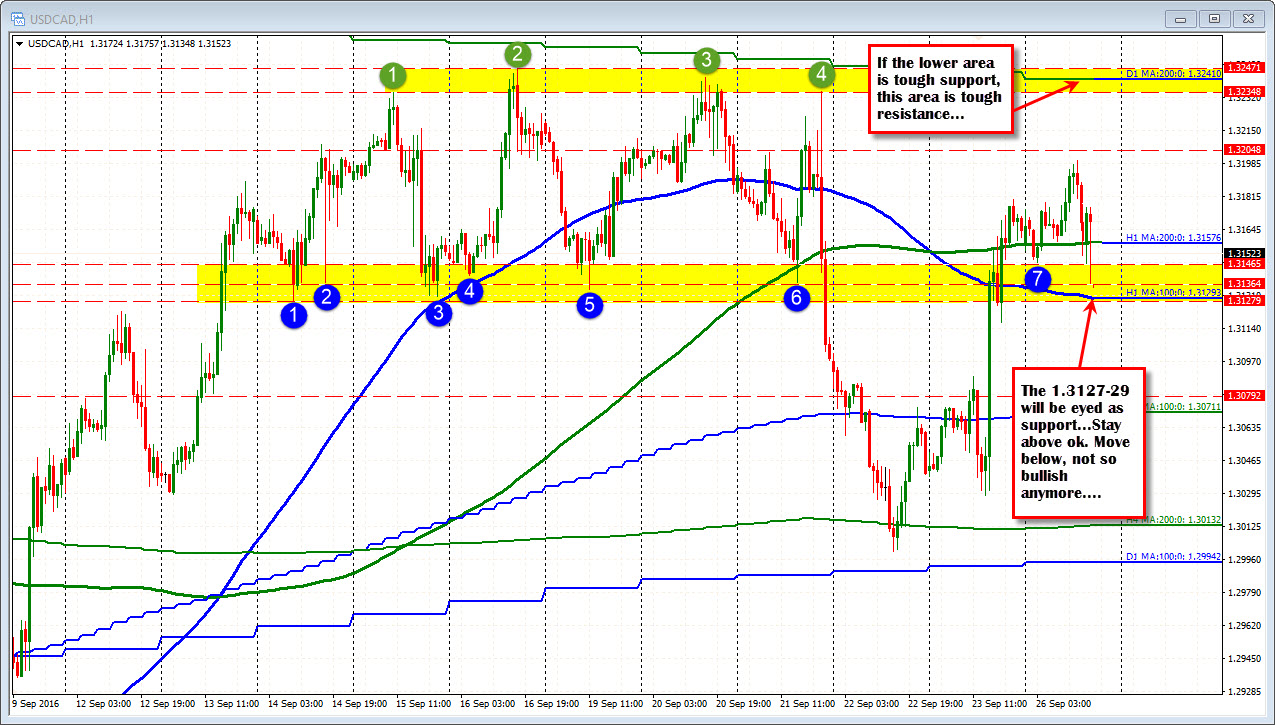
Last week, that lowest swing low was broken on Wednesday and it led to a sharp move lower. That move stalled just above the 100 day MA (see low blue line currently at 1.29943 - D1 MA:100). The rally on Friday extended back above the lower yellow area the defined a lower extreme from Sept 13 to Sept 21 That area will define bullish above/ bearish below for me this week. I expect traders to lean against the level on tests (like it just did), but for sell stops to be triggered - and the bias to shift from bullish to bearish - if broken.
For now, the sellers tested. The buyers responded on the first test.
ON the topside, the upper yellow area has 4 separate tests (see green circles). IF the lower yellow area is good support, the upper yellow area (between 1.3234-47) is just as tough resistance. Can you expect sellers against it on a test? Yep. The same rules apply on a break above though. That is if broken, look for stops to be triggered, and the bias to become more bullish.
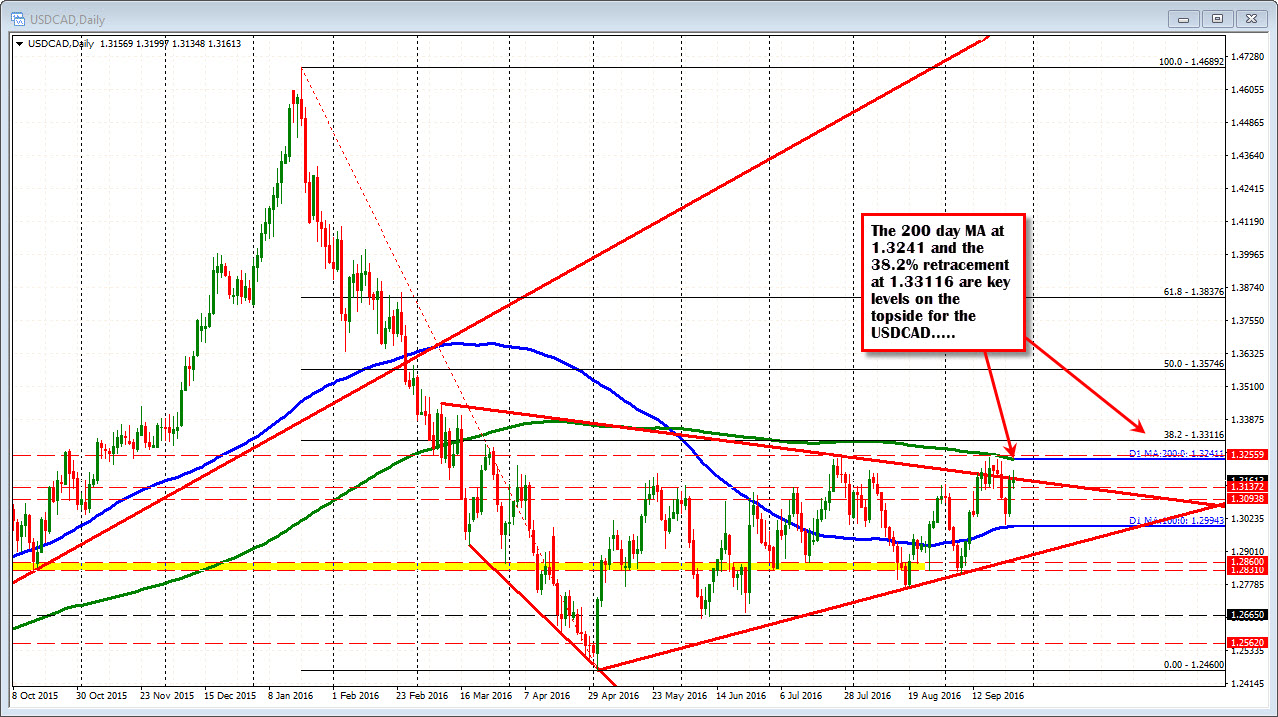
PS On the daily chart (see below), the 200 day MA (green line in the chart) cuts across at 1.3241 level currently. A move above that level will be the first break since March 16. That level and the 38.2% of the move down from the January 16 high at 1.33116 are the next key topside targets (see chart below) to get to and through if the bulls are to take more control in this pair. That 200 day MA is in the topside yellow area from the hourly chart. That increases that levels technical importance.