Building permit (-12.9%) and Mechandise trade (-2.45B) weak
The USDCAD got a double shot of bullish strength from stronger US data today and weaker Canada data.
US NFP rose by a greater than expected 295K jobs (vs 235K estimate). In Canada, building permits tumbled by -12.9% and the merchandise trade fell -2.45% with exports falling by -2.8% (imports were little changed). This was the second highest trade deficit on record. The decline in exports could be traced to one thing - the oil price decline (-23% for the month). Ex-oil, exports increased by +0.2%.
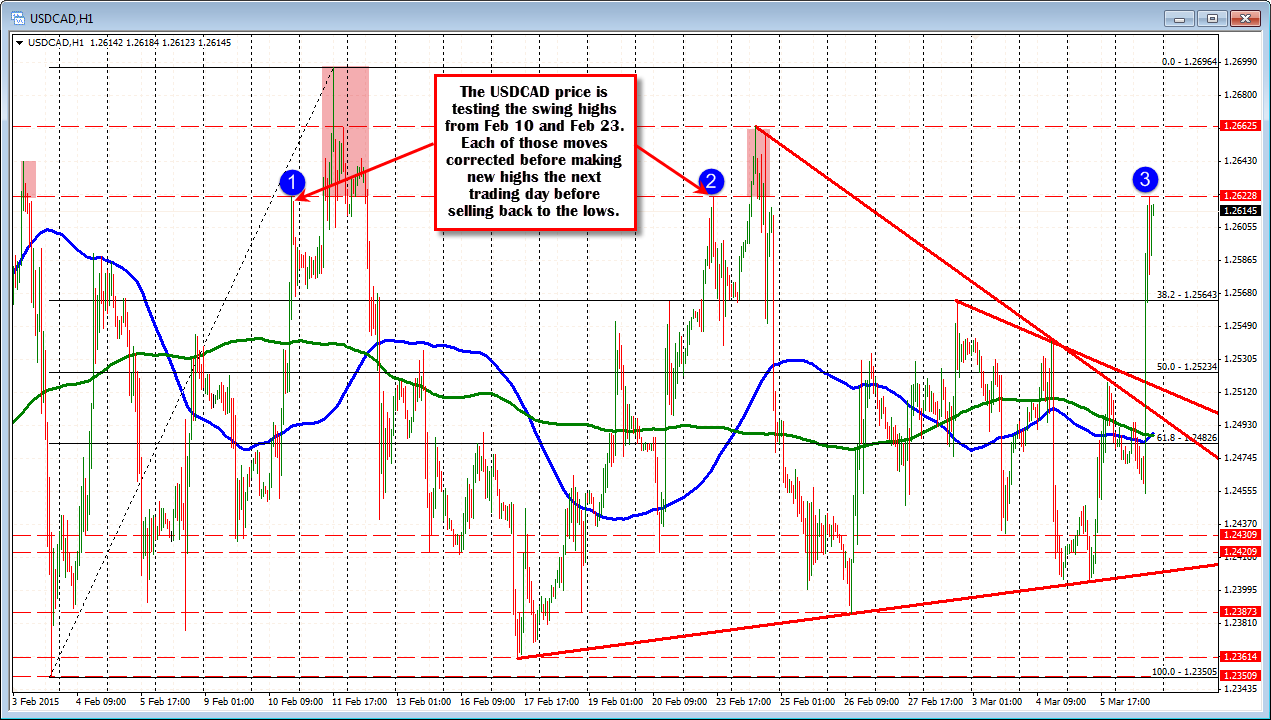
The current price is testing resistance against a two swings highs seen over the last month of trading. That level comes in at 1.2623 (see hourly chart above). On each of those highs (see blue circled numbers in the chart above), the price corrected off the level, but made new highs the very next day. From those highs, the price tumbled back to the lows. Will the pattern repeat?
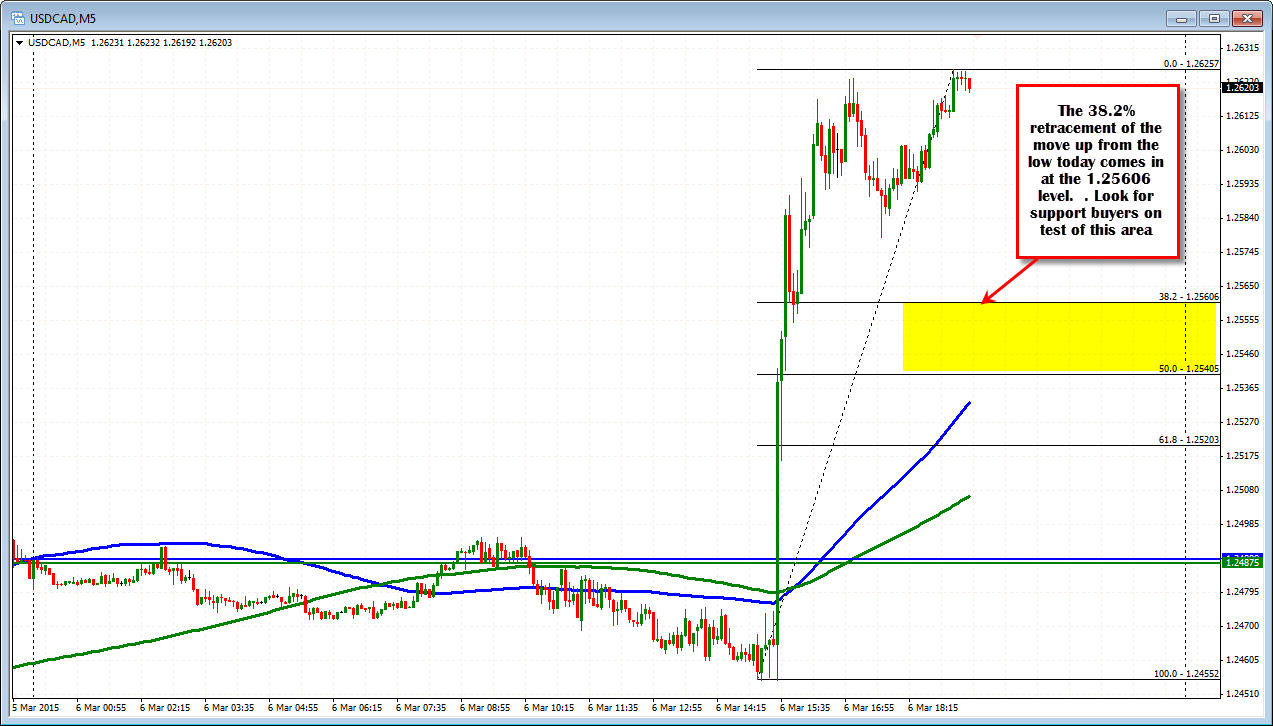
If there is a correction, the 1.2560-64 area would be the support target below. This level corresponds with the 38.2% of the month long trading range. It is also the 38.2% of the move up from the low today (see chart below).
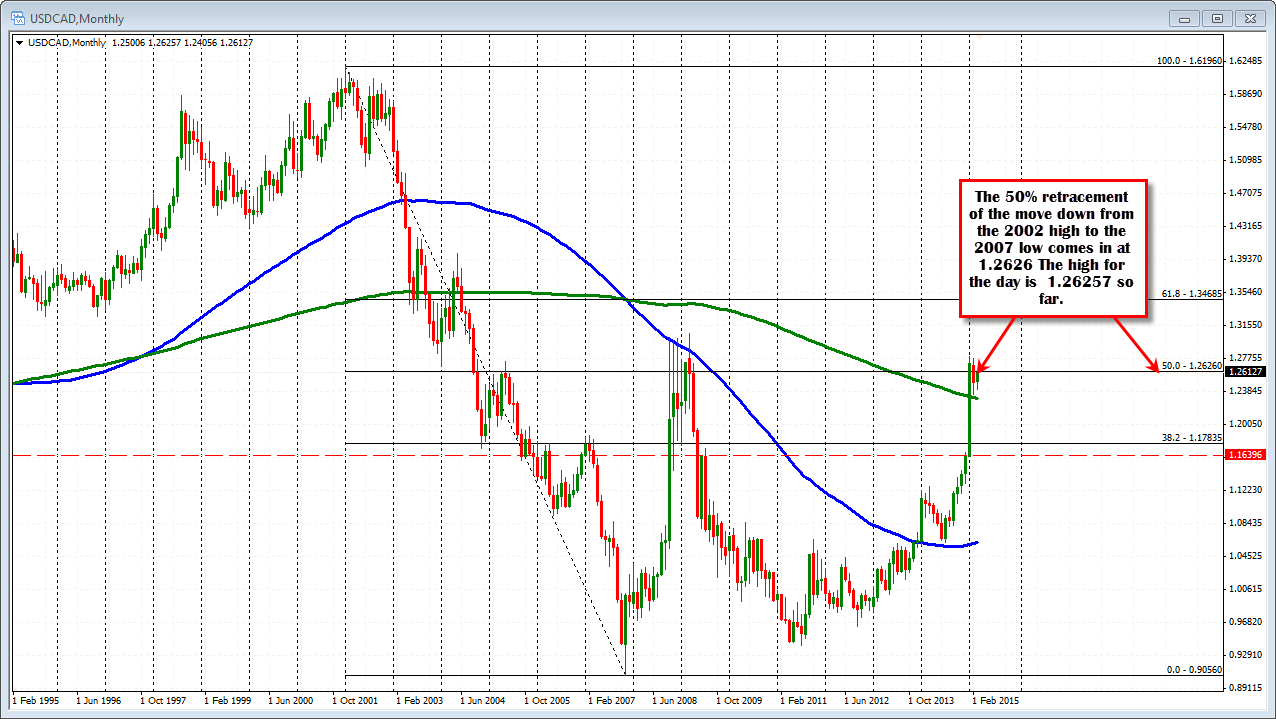
Looking at the monthly chart, the reason for the resistance against this area stems from a key technical level. The 1.2626 level represents the 50% of the move down from the 2002 high to the 2007 low. The high for the day currently, is 1.26257. Needless to say, the level is a key technical level If traders can lean against a key level with limited risk, they will often give the level a chance - especially after an oversized gain like we've seen today. If it holds however, next week might be a different story. Be aware..