
Above 100 hour MA (midpoint area).
The USDCAD is testing the highs for the day and looks at a trend line (UPDATE: Breaking above now). The price is back above the 100 hour MA (now risk for longs). Earlier in the day, the price fell below the 200 hour MA but had plenty of other support that stalled the fall. Risk could be defined and limited at the bottom yellow are that runs from 1.3128 to 1.3146. There are a number of swing lows inthat area over the last 6 trading days.
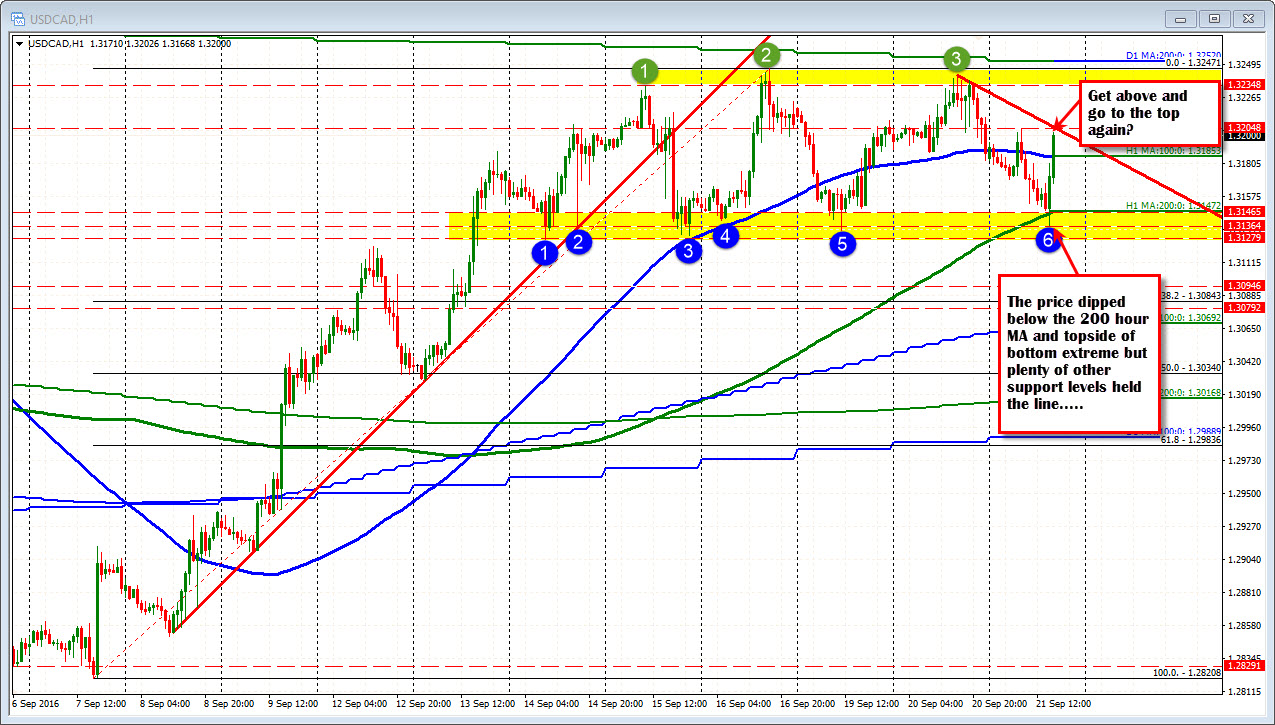
On the topside, there is an equal ceiling area. The 1.3234-47 has 3 separate highs and just above that is the 200 day MA at the 1.3252 level.
Ceiling above. Floor below. About a 100 pips in the range. In between is a sideways 100 hour MA at 1.3185. It looks like traders are trading and ping ponging until the "market" says "Let's go and get out of this range".
PS, the trend line and high and old high for the day is being broken now. Are we heading to the 1.3234-52 area? Ping....Pong...

