
Retracement levels on hourly and daily charts
The USDCAD is moving lower in the trading and looks toward key support against retracement levels on the hourly and daily charts. The low today has reached 1.3583 so far.
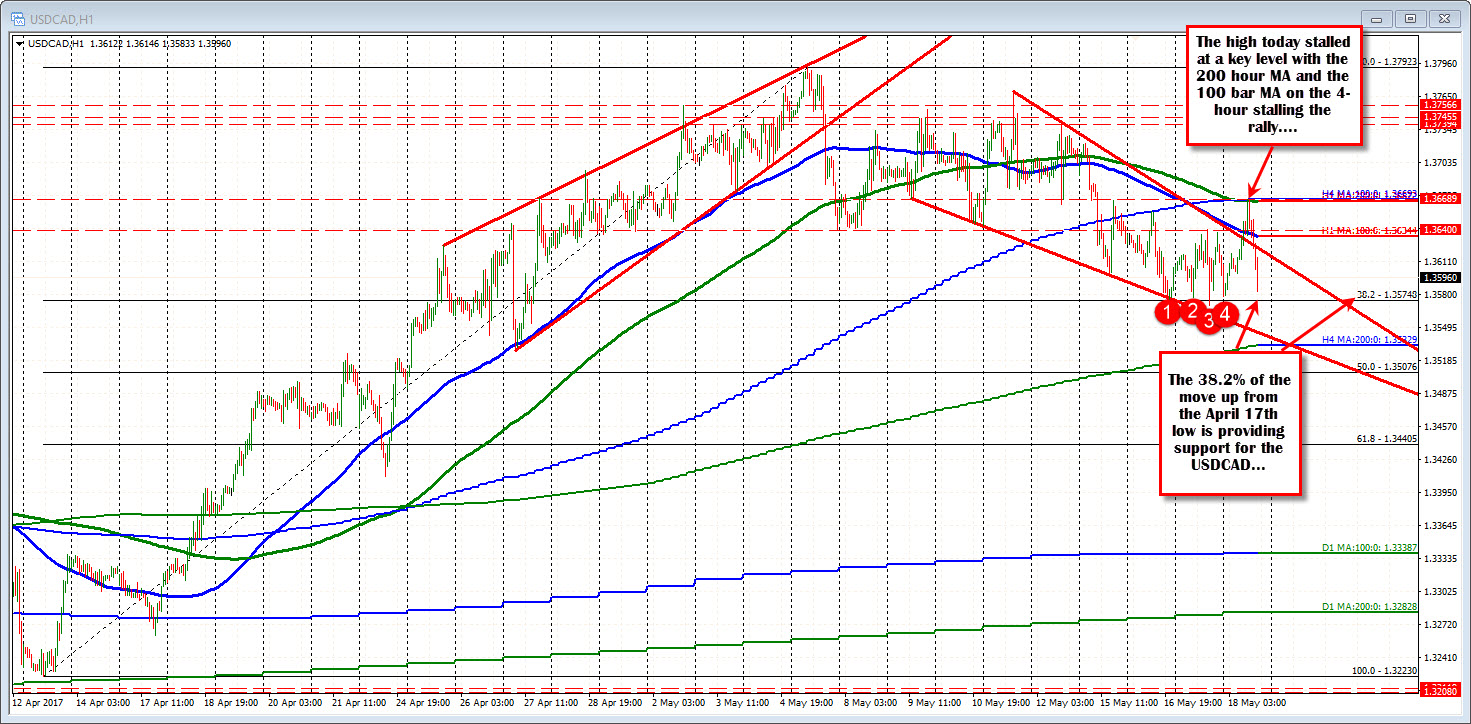
Looking at the hourly chart, the 38.2% retracement of the move up from the April 13 low comes and of 1.35748. On Tuesday and Wednesday (and again at the start of trading today - the low reached 1.3579), that level was tested and found support buyers.
Looking at the daily chart below, the 1.35746 level represents the 50% retracement of the moved down from the January 2015 high to the May 2016 low. In November and December of 2016, that 50% level was broken but only for a day or two.
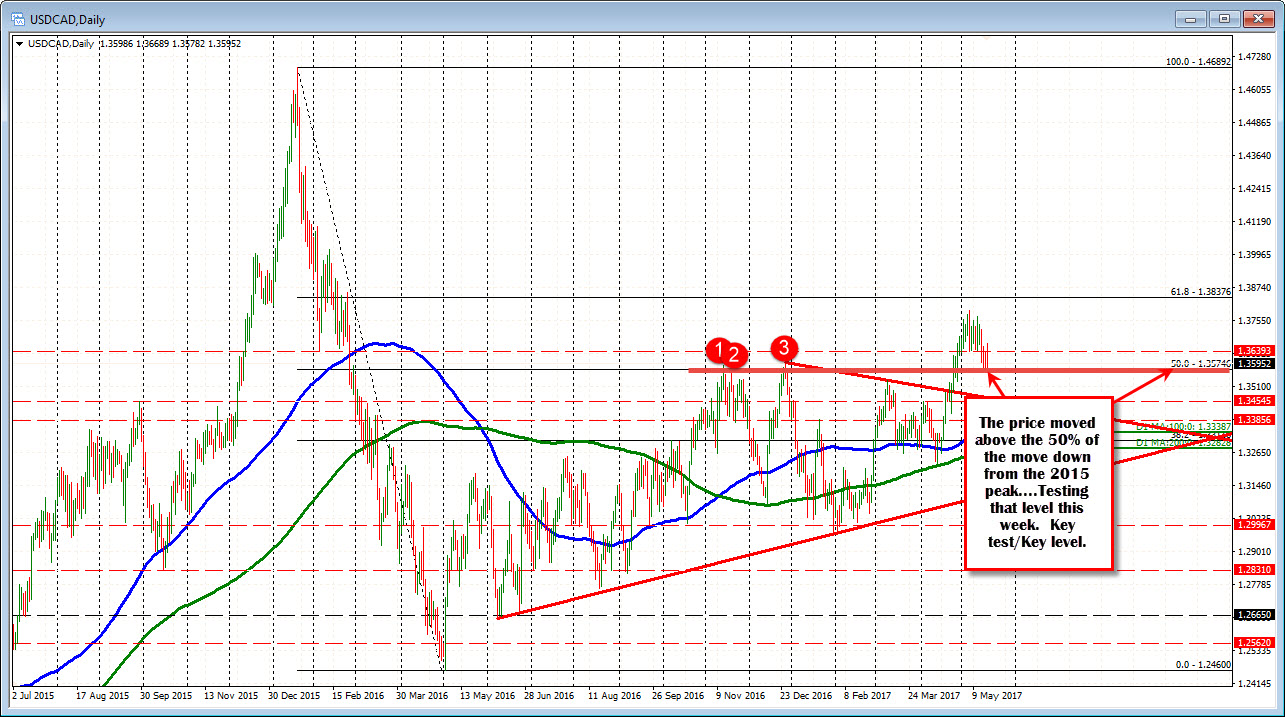
Needless to say, the level is a key level for traders. Stay above, the bulls remain in control. Move below and we should see more downside corrective action for the pair.
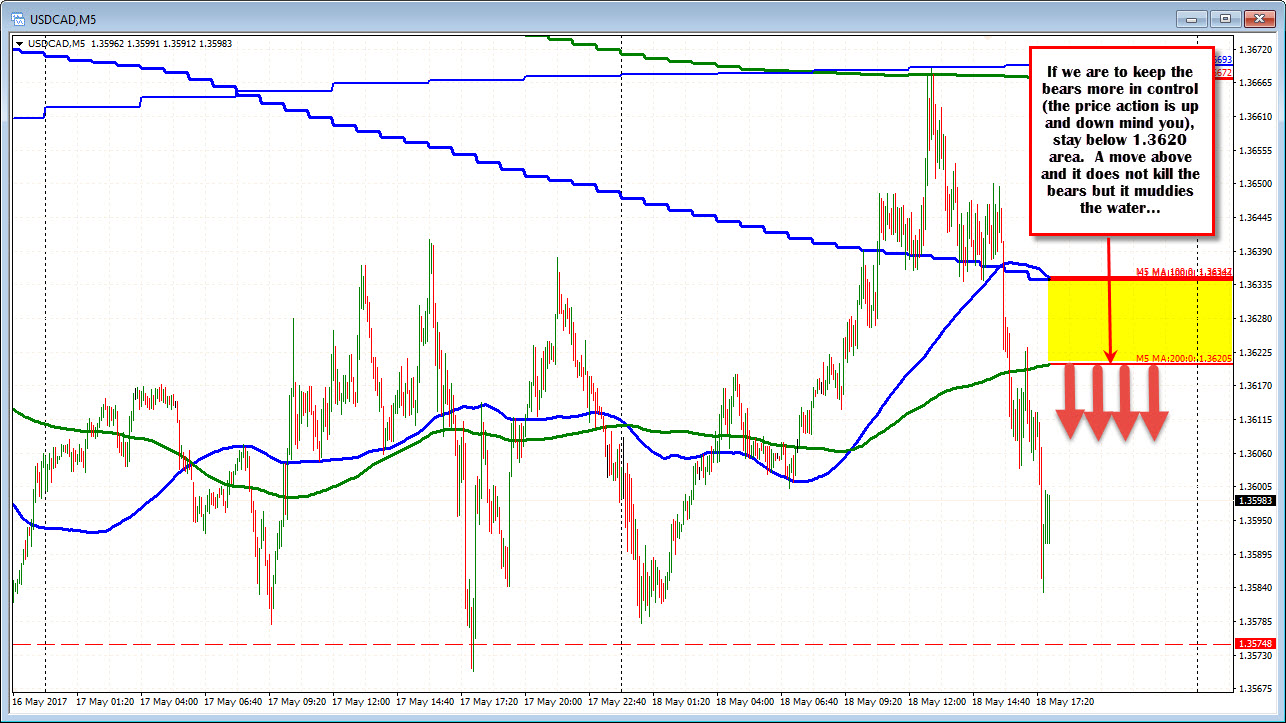
Drilling to the 5- minute chart below, the price action today has been up and down. At the highs today, the pair held a key technical level with both the 200 hour MA and the 100 bar MA on the 4-hour chart holding (at 1.3667-69). Now, we move toward key support (again). We are currently below the 100 and 200 bar MA on the 5-minute chart at 1.3616 and 1.3634 respectively. The price is also below the 100 hour MA at the same 1.3634 level. For me today, the support level has to be respected again. Stay above more bullish. But buyers do need to get the price back above the 1.3620 level. If they can, the technical picture starts to look more positive again.
PS WTI oil is trading at $49.22, up $.15 on the day. The low extended to $48.05 while the high for the day reached $49.34. So we trade near the high levels of the day. That is helping to support the CAD a bit.

