
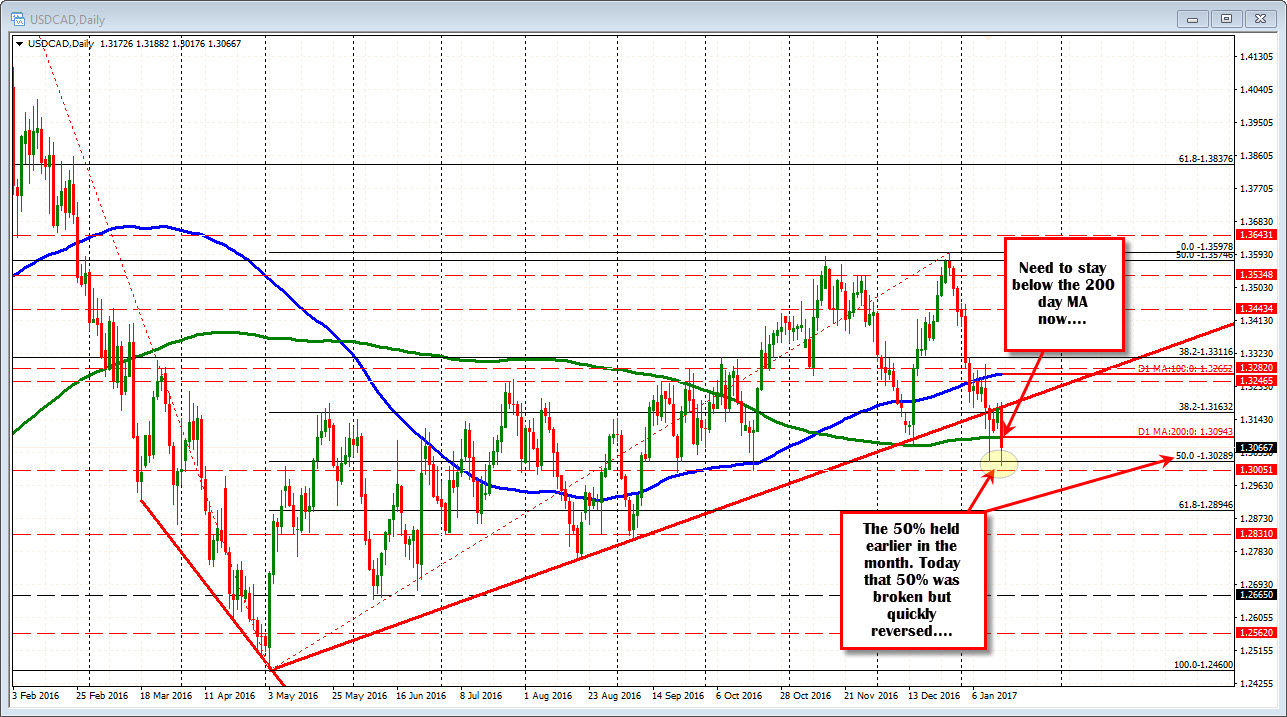
Makes new lows going back to Oct 19 and dips below 50% retracement level but back higher
The USDCAD reached new 2017 year lows - taking out the lows from January 12th (at 1.3028) and the 50% of the move up from the May low in the process (at 1.30289). The low extended to 1.30176 and rebounded.
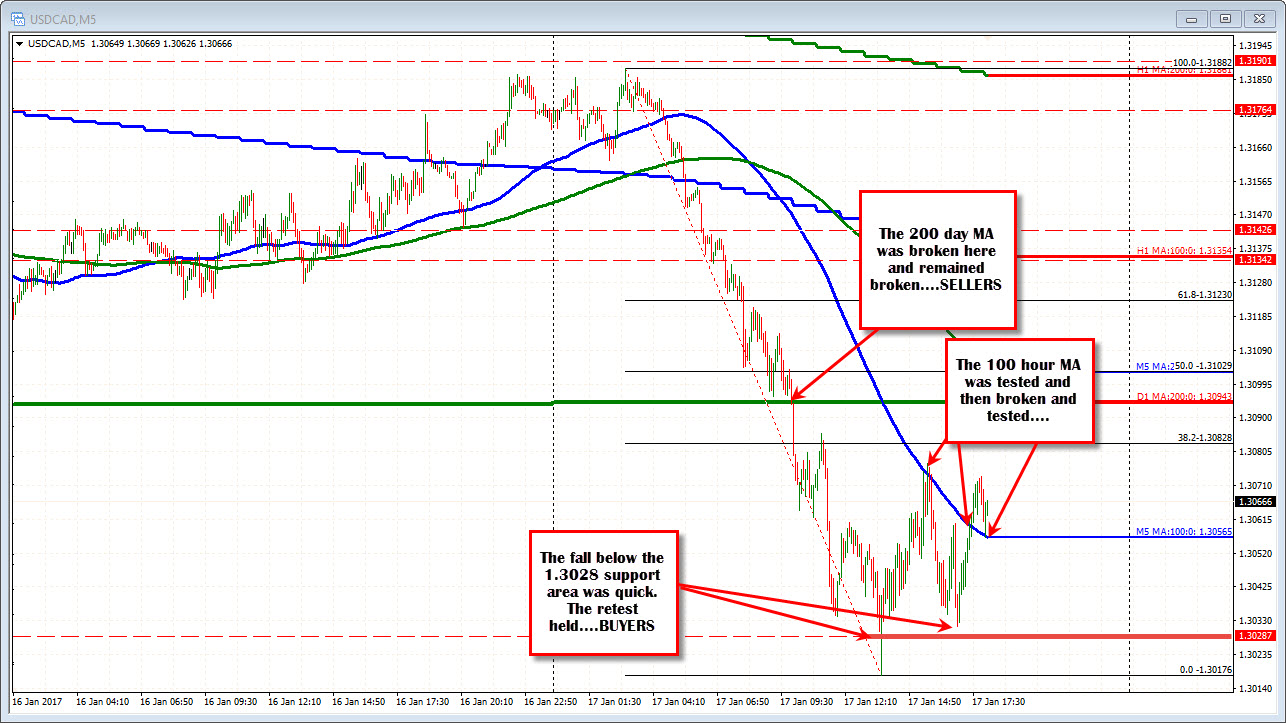
Drilling down into the 5 minute chart, the dip below the support at 1.3029 was short lived. The single 5 minute bar went below but closed back above and corrected to the 100 bar MA (blue line). The price did rotate back lower in the NY session but buyers came in against the support level on the 2nd test (see chart below).
The price action since the low is more consolidative but with some bullish clues. The price has moved above the 100 bar MA (blue line) at 1.3056 AND just tested it and held. Stay above that MA line is more bullish intraday at least. The 38.2% at 1.30828 is the next target to get and stay above.
So overall, the decline below the 200 day MA is more bearish. However, support - although broken briefly - pretty much held too.
We now sit in the middle between the 1.3028 level support, and the 200 day MA at 1.3094. Intraday, the close support is the 100 bar MA on the 5 minute chart. Stay above and the 38.2% at 1.3082 is a possibility. I would expect strong resistance against the 200 day MA though (at 1.3094) IF we see further momentum. On the downside, a move back below the 100 bar MA on the 5- minute, should scare the buyers a bit, and we could/should see the sellers take back more intraday trading control.

